ggtree学习笔记

写在前面

Y叔的ggtree $^{[1]}$ 毫无疑问是当前绘制美化系统发育树(下文简称进化树)的最佳工具,一直想学习,但是都没有真真正正学习过,一是因为网上关于gtree的中文资源较少,另外一个原因是感觉到自己用不上,就没认真学习。春节在家,实在无聊,下定决心学一遍ggtree。下面的内容来自Y叔的博客$^{[2]}$ ,若有不当之处,恳请批评指正。

关于进化树

进化树怎么看

进化树展示的是进化关系,简单说就是亲缘关系,通常是使用物种的遗传序列(如DNA序列、氨基酸序列等)来构建的。进化树看起来和层次聚类很像,这两者有木有区别呢?Y叔在统计之都上的文章$^{[3]}$ 是这样描述的:

层次聚类的侧重点在于分类,把距离近的聚在一起。而进化树的构建可以说也是一个聚类过程,但侧重点在于推测进化关系和进化距离 (evolutionary distance)。
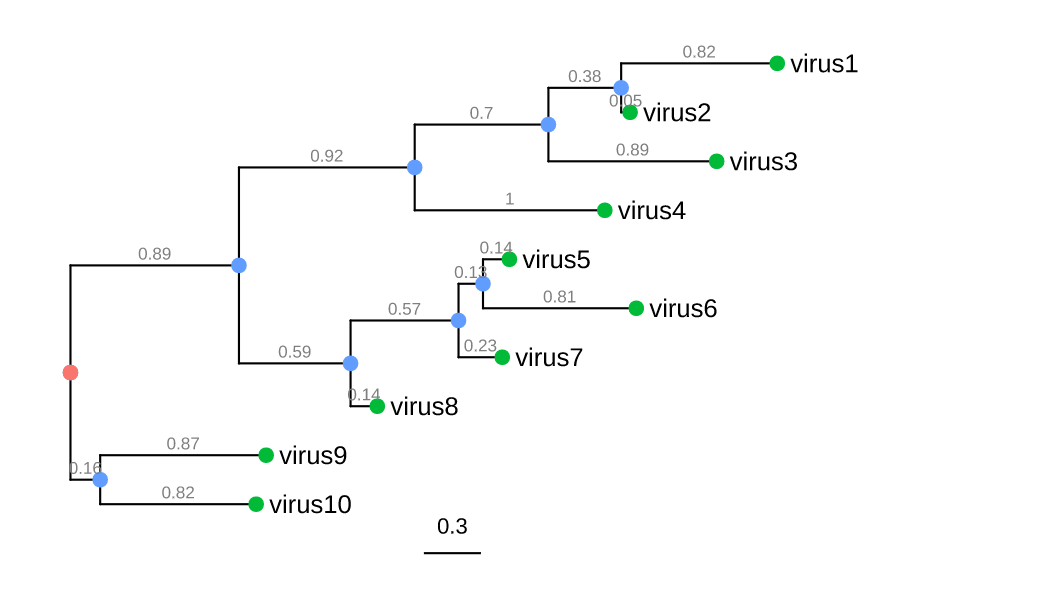
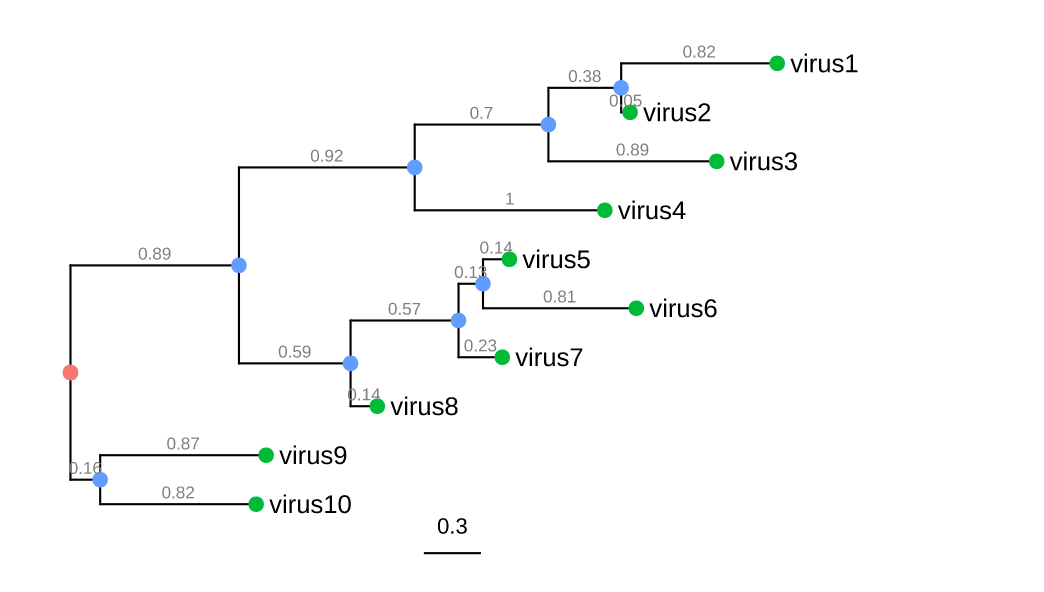
上图展示的是典型的系统发育树。图中绿色、蓝色和红色的点都是nodes,也就是节点(个人理解),其中最外层绿色的点表示的是每个sample,这时绿色的点也叫tips;蓝色的点表示的是父节点,也就是从外往内两两sample的共有节点,可以理解成祖先(ancestor),祖先之间还可以继续往上溯源,最终就汇集到红色的点,这个红色的点也就是root,需要注意的是有根树才具有root节点;横线叫做分支(branches),这些横线表示的是进化变化(evolutionary changes),线的长短表示的是以时间或遗传变异为单位的进化变化。

进化树数据格式

进化树的数据格式有多种,常见的有NewickNEXUSPhylip

Newick格式

Newick格式是最常见的使用最广泛的进化树数据格式。

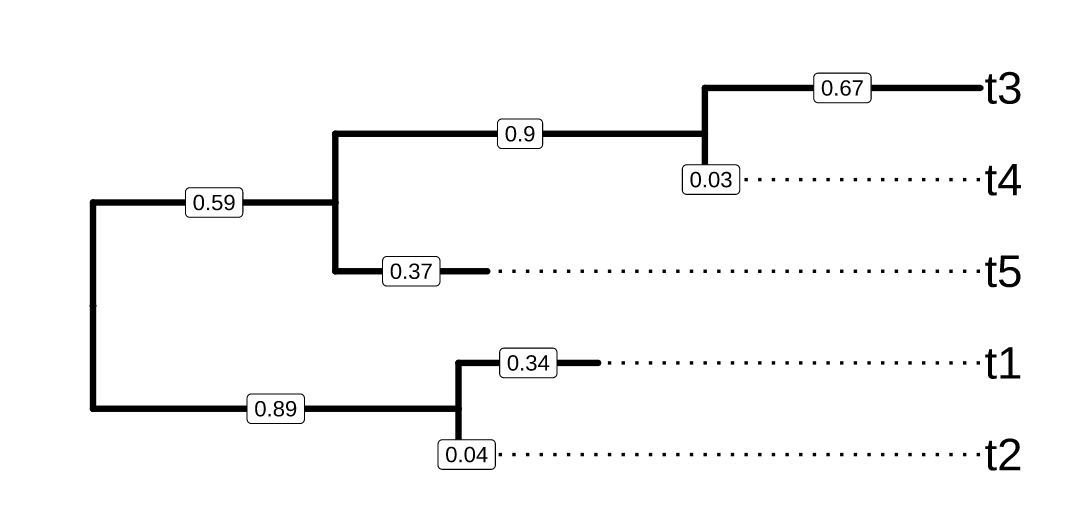
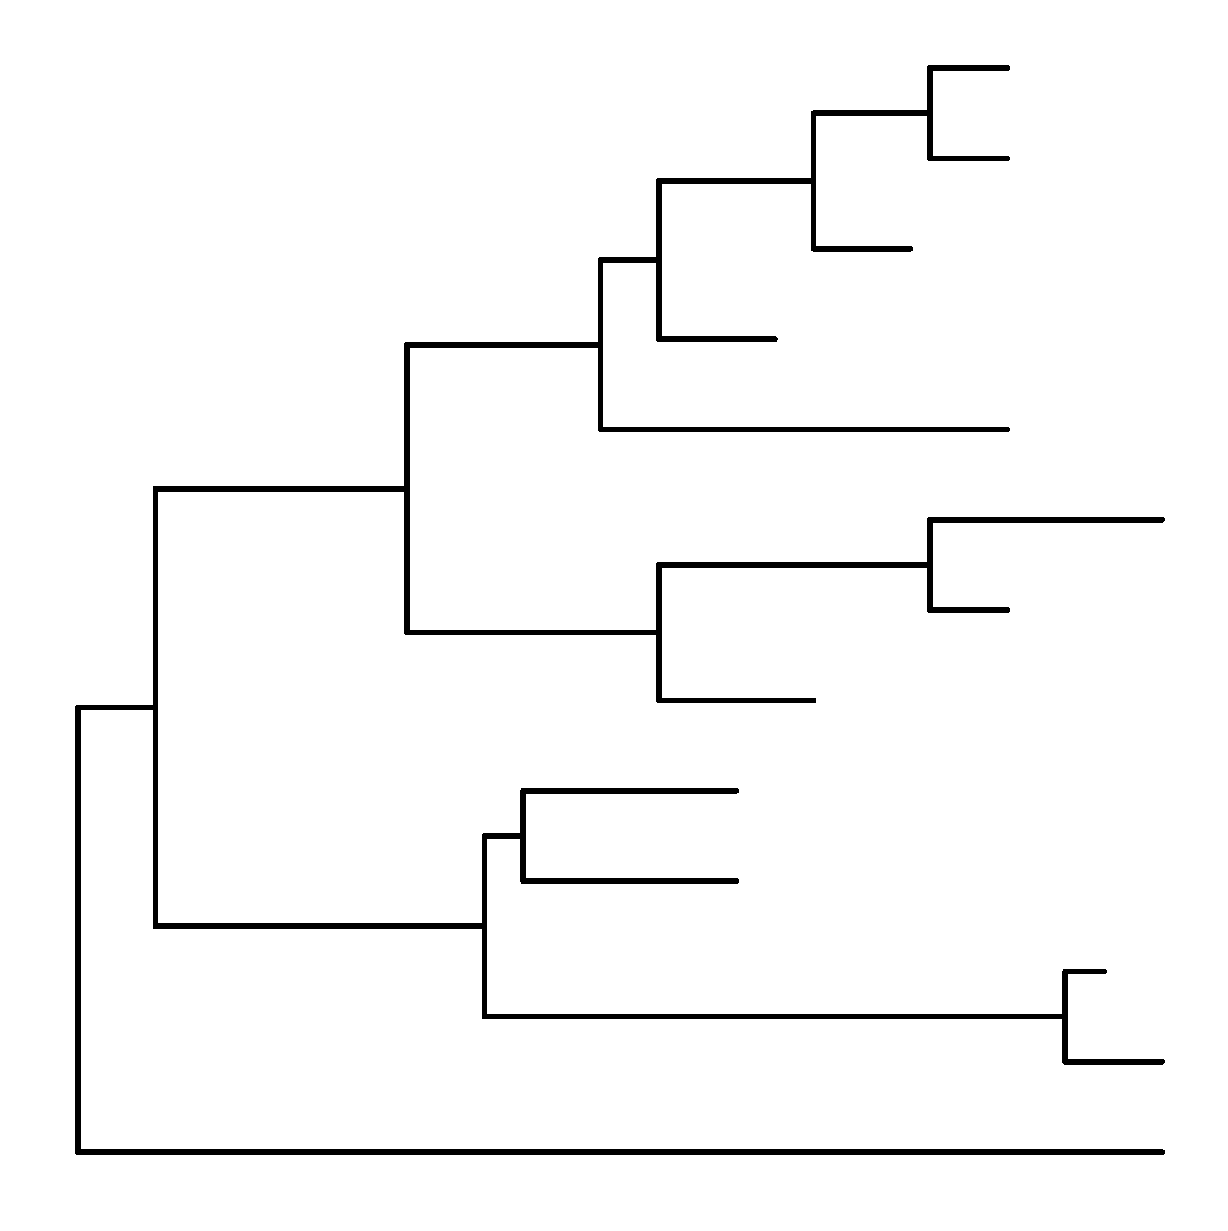
上图是一个标准的进化树图,其对应的Newick格式为:

1
((t2:0.04,t1:0.34):0.89,(t5:0.37,(t4:0.03,t3:0.67):0.9):0.59); 

数据格式和图是一一对应的,假如我们看图的时候是从外到内,那t3t4是最近的,在数据中,t3t4也是在一个括号里面的,数据的最小单位是一对(),就像剥洋葱那样顺着括号一层一层往外剥的时候,就能得到上图的那种样式。冒号后面对应的是横线上的“距离”,父节点的“距离”是两个“子节点”共有的,因此,需要表示“父节点”的“距离”时,需要将“距离”放在“子节点“的括号外。

NEXUS格式

NEXUS格式是Newick格式的拓展,以blocks为单位将进化树的元素分开。

1
2
3
4
5
6
7
8
9
10
11
12
13
14
15
16
17
18
19
20
21
22
23
24
#NEXUS
[R-package APE, Wed Nov 9 11:46:32 2016]

BEGIN TAXA;
DIMENSIONS NTAX = 5;
TAXLABELS
t5
t4
t1
t2
t3
;
END;
BEGIN TREES;
TRANSLATE
1 t5,
2 t4,
3 t1,
4 t2,
5 t3
;
TREE * UNTITLED = [&R] (1:0.89,((2:0.59,3:0.37):0.34,
(4:0.03,5:0.67):0.9):0.04);
END;

其他格式

进化树的存储格式还有很多种,更多请参照Y叔的博客$^{[4]}$。

进化树数据处理

进化树数据可以使用treeio$^{[5]}$ 这个包进行合并等操作,然后可以将其他信息利用tidytree$^{[6]}$ 这个包将树文件转换成R里面常见的数据框格式,这种格式也可以再次转化成树文件,利用ggtree进行可视化。

phylo对象

phylo格式是R包ape支持的格式,在R中的很多包都依赖于这种格式。tidytree中的函数as_tibble可以将phylo转换成数据框,此时的数据框是个tbl_tree对象。

1
2
3
4
5
6
library(ggtree)
library(ape)

set.seed(2017)
tree <- rtree(4)
tree

此时得到的是phylo对象:

1
2
3
4
5
6
7
## 
## Phylogenetic tree with 4 tips and 3 internal nodes.
##
## Tip labels:
## t4, t1, t3, t2
##
## Rooted; includes branch lengths.

现在将其转化成数据框:

1
2
3
library(tidytree)
x <- as_tibble(tree)
x
1
2
3
4
5
6
7
8
9
10
## # A tibble: 7 x 4
## parent node branch.length label
## <int> <int> <dbl> <chr>
## 1 5 1 0.435 t4
## 2 7 2 0.674 t1
## 3 7 3 0.00202 t3
## 4 6 4 0.0251 t2
## 5 5 5 NA <NA>
## 6 5 6 0.472 <NA>
## 7 6 7 0.274 <NA>

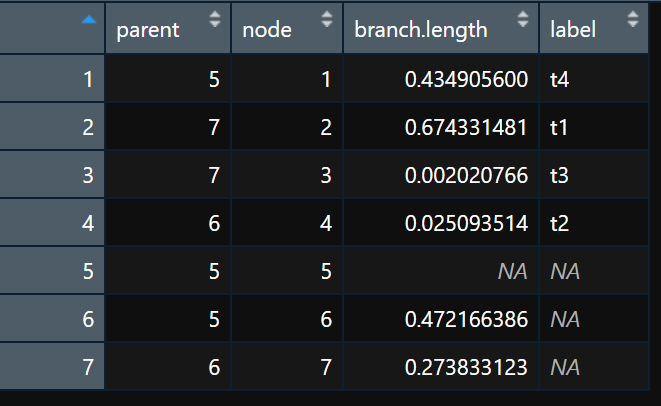
看图更直观:

可以清楚地看到进化树的全部信息,包括父节点、节点、分支长度及tips的标签等。

使用as.phylo(x)就能将数据框转换成phylo:

1
2
3
4
5
6
7
8
as.phylo(x)
##
## Phylogenetic tree with 4 tips and 3 internal nodes.
##
## Tip labels:
## t4, t1, t3, t2
##
## Rooted; includes branch lengths.

如果此时我们需要添加信息的话,在原始文件上添加信息是比较麻烦的,但是可以团购先构建数据框,然后将两个数据框join在一起就可以了:

1
2
3
4
5
d <- tibble(label = paste0('t', 1:4),
trait = rnorm(4))

y <- full_join(x, d, by = 'label')
y

treedata对象

tidytree默认的格式是treedata,函数as.treedata可以将前面的数据框转换成treedata对象:

1
as.treedata(y)
1
2
3
4
5
6
7
8
9
10
11
12
## 'treedata' S4 object'.
##
## ...@ phylo:
## Phylogenetic tree with 4 tips and 3 internal nodes.
##
## Tip labels:
## t4, t1, t3, t2
##
## Rooted; includes branch lengths.
##
## with the following features available:
## 'trait'.

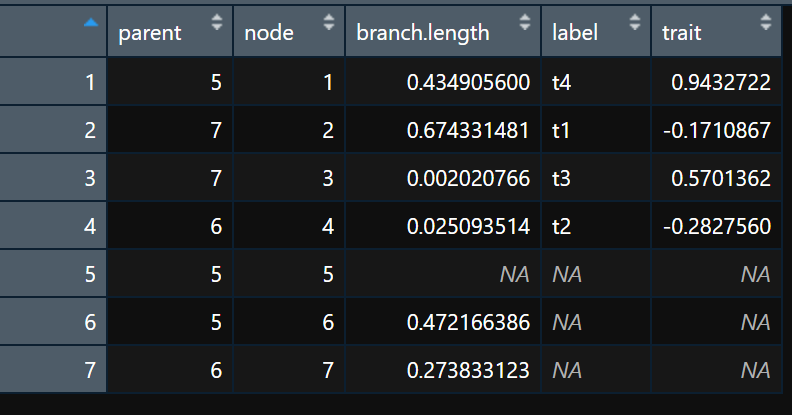
同样也可以通过as_tibbletreedata转换成数据框格式:

1
y %>% as.treedata %>% as_tibble
1
2
3
4
5
6
7
8
9
10
## # A tibble: 7 x 5
## parent node branch.length label trait
## <int> <int> <dbl> <chr> <dbl>
## 1 5 1 0.435 t4 0.943
## 2 7 2 0.674 t1 -0.171
## 3 7 3 0.00202 t3 0.570
## 4 6 4 0.0251 t2 -0.283
## 5 5 5 NA <NA> NA
## 6 5 6 0.472 <NA> NA
## 7 6 7 0.274 <NA> NA

树文件融合

treeio同的函数merge_tree()可以对多个树文件进行合并,原理是以node/branches为`key进行数据合并,如:

1
2
3
4
5
6
7
8
9
library(treeio)
beast_file <- system.file("examples/MCC_FluA_H3.tree", package="ggtree")
rst_file <- system.file("examples/rst", package="ggtree")
mlc_file <- system.file("examples/mlc", package="ggtree")
beast_tree <- read.beast(beast_file)
codeml_tree <- read.codeml(rst_file, mlc_file)

merged_tree <- merge_tree(beast_tree, codeml_tree)
merged_tree
1
2
3
4
5
6
7
8
9
10
11
12
13
14
15
16
17
18
19
20
## 'treedata' S4 object that stored information of
## '/home/ygc/R/library/ggtree/examples/MCC_FluA_H3.tree',
## '/home/ygc/R/library/ggtree/examples/rst',
## '/home/ygc/R/library/ggtree/examples/mlc'.
##
## ...@ phylo:
## Phylogenetic tree with 76 tips and 75 internal nodes.
##
## Tip labels:
## A/Hokkaido/30-1-a/2013, A/New_York/334/2004, A/New_York/463/2005, A/New_York/452/1999, A/New_York/238/2005, A/New_York/523/1998, ...
##
## Rooted; includes branch lengths.
##
## with the following features available:
## 'height', 'height_0.95_HPD', 'height_median',
## 'height_range', 'length', 'length_0.95_HPD',
## 'length_median', 'length_range', 'posterior', 'rate',
## 'rate_0.95_HPD', 'rate_median', 'rate_range', 'subs',
## 'AA_subs', 't', 'N', 'S', 'dN_vs_dS', 'dN', 'dS', 'N_x_dN',
## 'S_x_dS'.

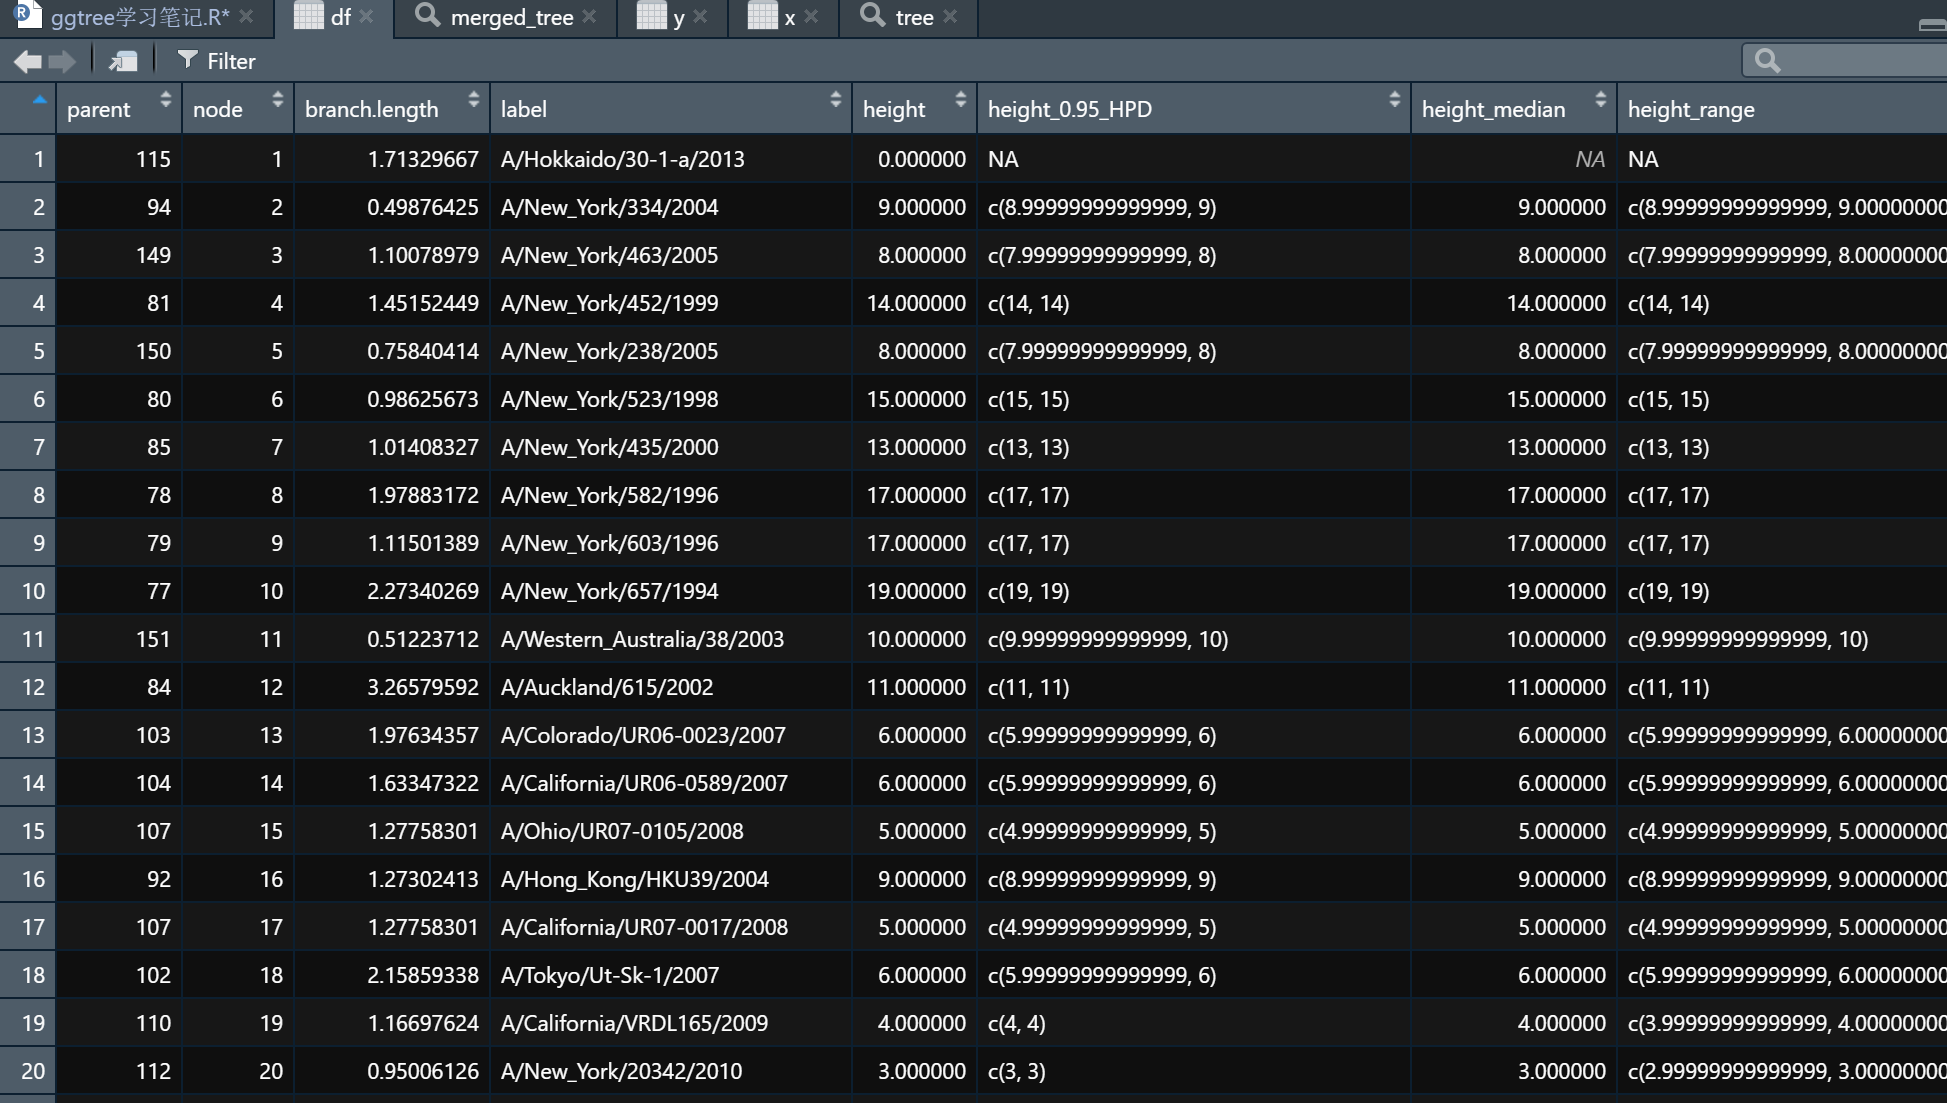
合并后的树文件,除开nodebranches外,其余的所有附加信息都变成了变量。

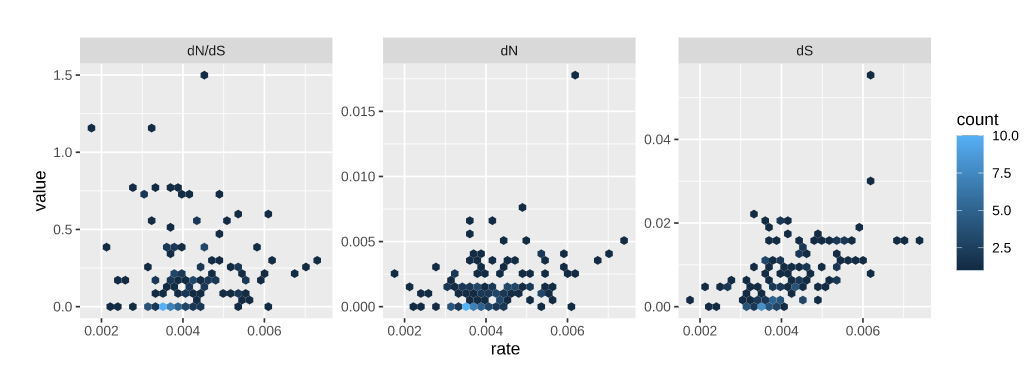
既然是个数据框,那就可以对这些数据进行可视化:

1
2
3
4
5
6
7
8
9
10
library(dplyr)
df <- merged_tree %>%
as_tibble() %>%
select(dN_vs_dS, dN, dS, rate) %>%
subset(dN_vs_dS >=0 & dN_vs_dS <= 1.5) %>%
tidyr::gather(type, value, dN_vs_dS:dS)
df$type[df$type == 'dN_vs_dS'] <- 'dN/dS'
df$type <- factor(df$type, levels=c("dN/dS", "dN", "dS"))
ggplot(df, aes(rate, value)) + geom_hex() +
facet_wrap(~type, scale='free_y')

还可以利用该函数比较不同软件的分析结果:

1
2
3
4
5
6
phylo <- as.phylo(beast_tree)
N <- Nnode2(phylo)
d <- tibble(node = 1:N, fake_trait = rnorm(N), another_trait = runif(N))
fake_tree <- treedata(phylo = phylo, data = d)
triple_tree <- merge_tree(merged_tree, fake_tree)
triple_tree

链接外部数据

进化树能够展示的东西不仅仅是进化关系,还可以增添许多信息,如基因表达量啥的。treeio的函数full_join()能够通过nodetips进行数据融合:

  • 通过node

    1
    2
    3
    4
    5
    6
    7
    8
    9
    10
    11
    12
    library(ape)
    data(woodmouse)
    d <- dist.dna(woodmouse)
    tr <- nj(d)
    bp <- boot.phylo(tr,
    woodmouse,
    function(x) nj(dist.dna(x)))

    bp2 <- tibble(node=1:Nnode(tr) + # 计算父节点数
    Ntip(tr), # 计算tip数
    bootstrap = bp)
    full_join(tr, bp2, by="node")
  • 通过tips

    1
    2
    3
    4
    file <- system.file("extdata/BEAST", "beast_mcc.tree", package="treeio")
    beast <- read.beast(file)
    x <- tibble(label = as.phylo(beast)$tip.label, trait = rnorm(Ntip(beast)))
    full_join(beast, x, by="label")

如何找到想要的node

1
2
3
4
5
6
7
8
9
library(ggtree)
library(ggplot2)

set.seed(1)
tr = rtree(10)

p +
geom_label(aes(x=branch, label=node))+
geom_hilight(node=12, fill="steelblue", alpha=.6)

分组

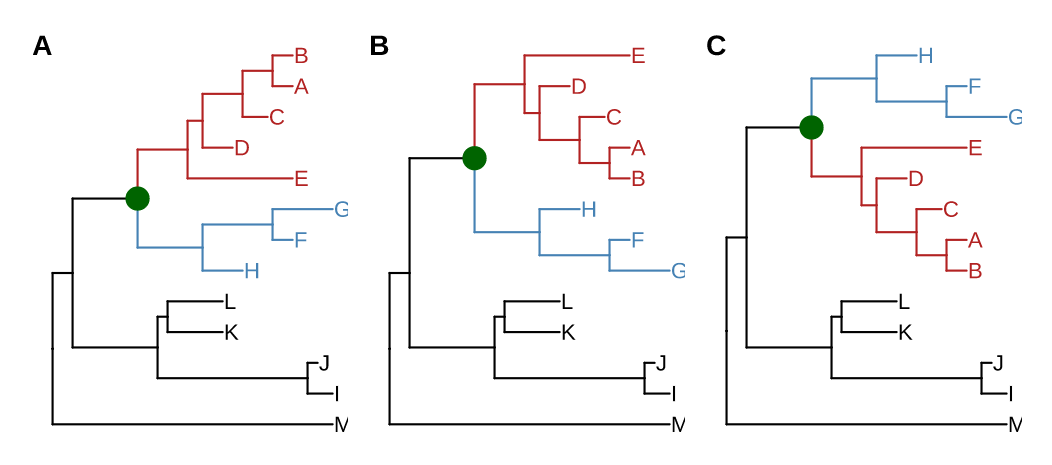
treeio中的函数 groupOTU()groupClade() 可以用于分组。

groupClade

1
2
3
4
nwk <- '(((((((A:4,B:4):6,C:5):8,D:6):3,E:21):10,((F:4,G:12):14,H:8):13):13,((I:5,J:2):30,(K:11,L:11):2):17):4,M:56);'
tree <- read.tree(text=nwk)

groupClade(as_tibble(tree), c(17, 21))
1
2
3
4
5
6
7
8
9
10
11
12
13
14
## # A tibble: 25 x 5
## parent node branch.length label group
## <int> <int> <dbl> <chr> <fct>
## 1 20 1 4 A 1
## 2 20 2 4 B 1
## 3 19 3 5 C 1
## 4 18 4 6 D 1
## 5 17 5 21 E 1
## 6 22 6 4 F 2
## 7 22 7 12 G 2
## 8 21 8 8 H 2
## 9 24 9 5 I 0
## 10 24 10 2 J 0
## # … with 15 more rows

node17node21为界将clade进行分组。这两个函数可以作用于tbl_treephylotreedataggtree 这些对象。

groupOTU

1
2
3
4
5
set.seed(2017)
tr <- rtree(4)
x <- as_tibble(tr)
## 输入的节点可以是节点ID,也可以是Label
groupOTU(x, c('t1', 't4'), group_name = "fake_group")
1
2
3
4
5
6
7
8
9
10
## # A tibble: 7 x 5
## parent node branch.length label fake_group
## <int> <int> <dbl> <chr> <fct>
## 1 5 1 0.435 t4 1
## 2 7 2 0.674 t1 1
## 3 7 3 0.00202 t3 0
## 4 6 4 0.0251 t2 0
## 5 5 5 NA <NA> 1
## 6 5 6 0.472 <NA> 1
## 7 6 7 0.274 <NA> 1

更常见的分组方法是直接命名分组:

1
2
3
4
5
6
cls <- list(c1=c("A", "B", "C", "D", "E"),
c2=c("F", "G", "H"),
c3=c("L", "K", "I", "J"),
c4="M")

as_tibble(tree) %>% groupOTU(cls)
1
2
3
4
5
6
7
8
9
10
11
12
13
14
## # A tibble: 25 x 5
## parent node branch.length label group
## <int> <int> <dbl> <chr> <fct>
## 1 20 1 4 A c1
## 2 20 2 4 B c1
## 3 19 3 5 C c1
## 4 18 4 6 D c1
## 5 17 5 21 E c1
## 6 22 6 4 F c2
## 7 22 7 12 G c2
## 8 21 8 8 H c2
## 9 24 9 5 I c3
## 10 24 10 2 J c3
## # … with 15 more rows

重新标准化分支

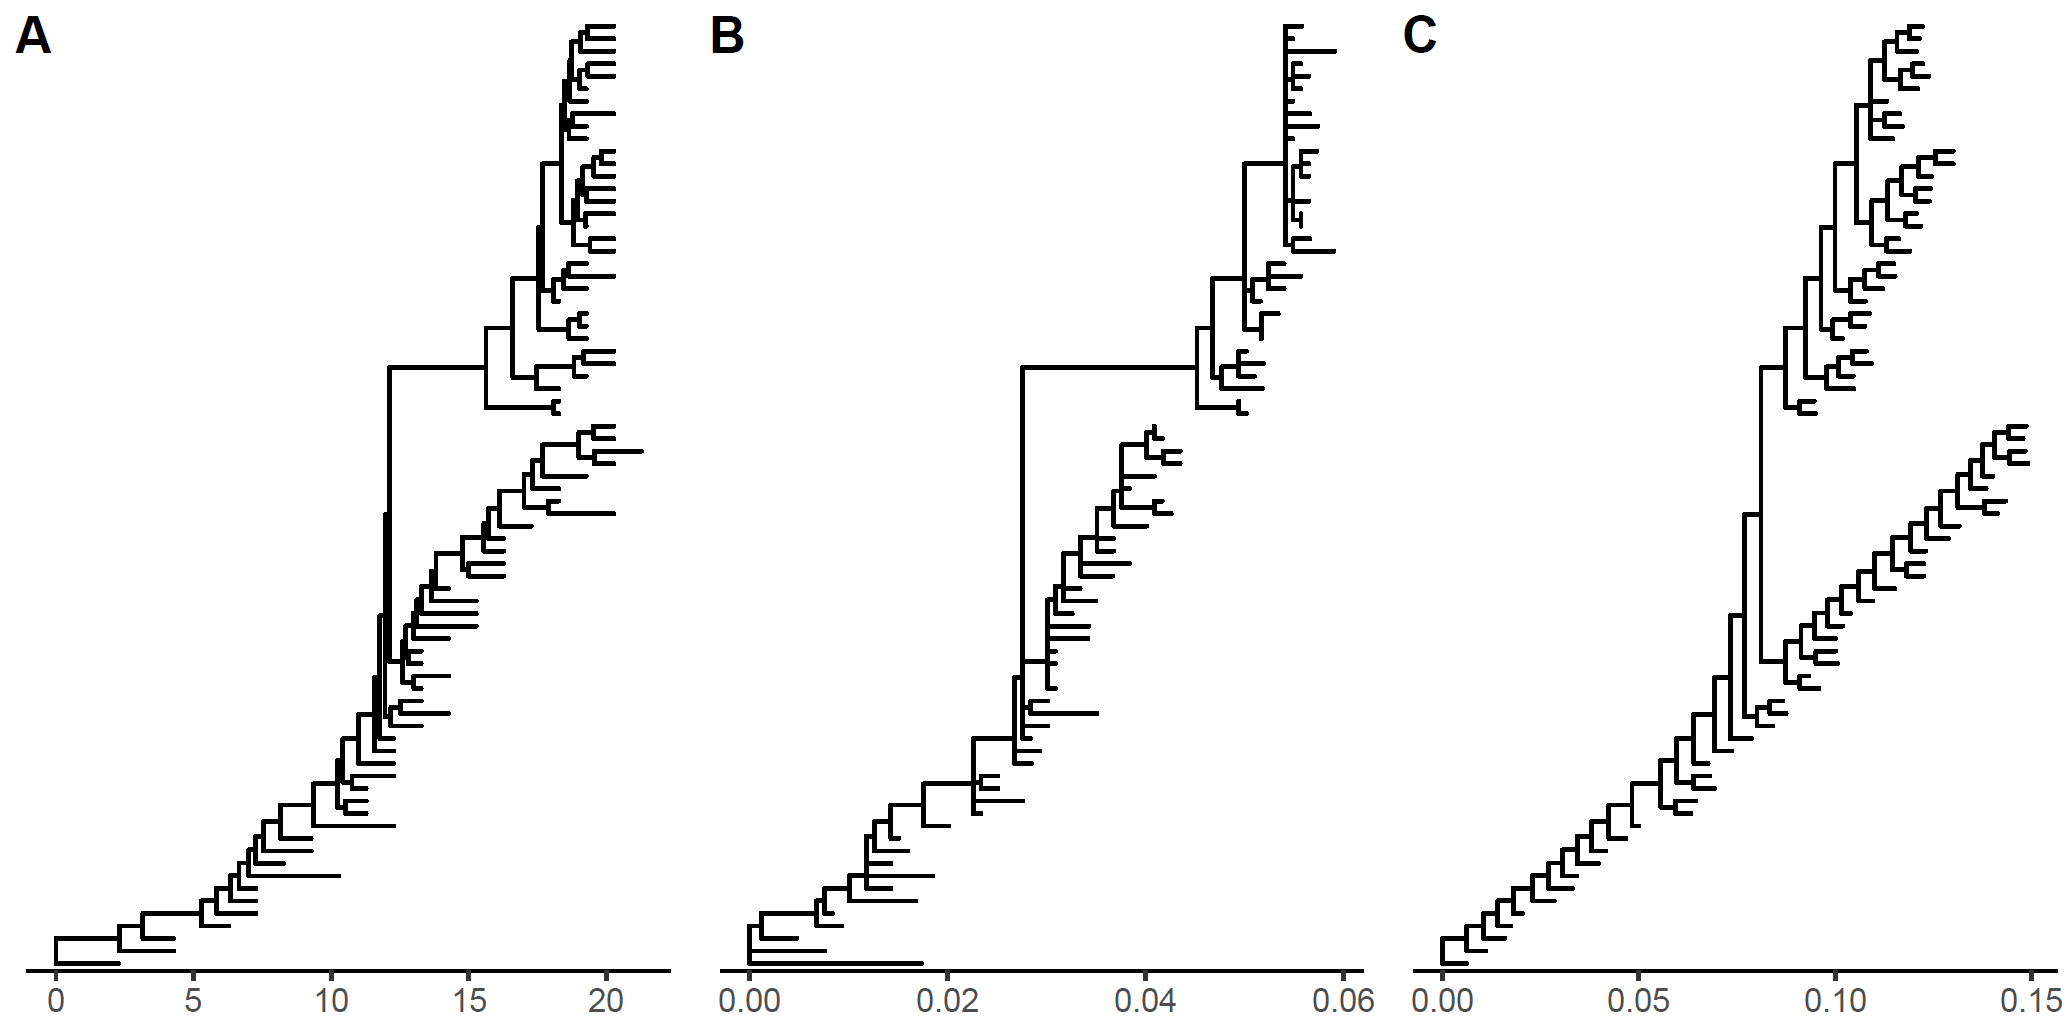
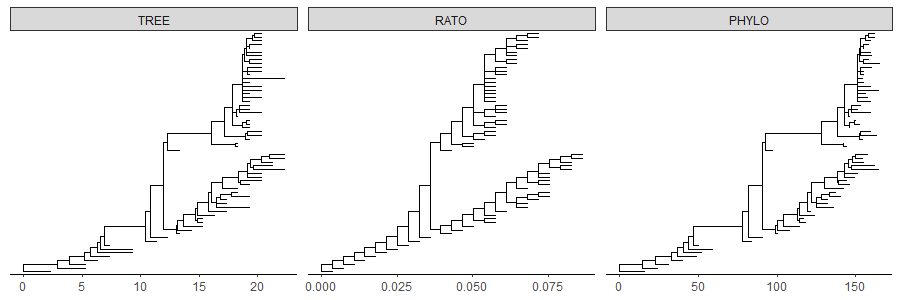
不同的进化树可以进行合并,原始的分支长度可能单位不一样,这时候就可以用合并后的其他参数对分支长度进行标准化。

1
2
3
4
5
p1 <- ggtree(merged_tree) + theme_tree2()
p2 <- ggtree(rescale_tree(merged_tree, 'dN')) + theme_tree2()
p3 <- ggtree(rescale_tree(merged_tree, 'rate')) + theme_tree2()

cowplot::plot_grid(p1, p2, p3, ncol=3, labels = LETTERS[1:3])

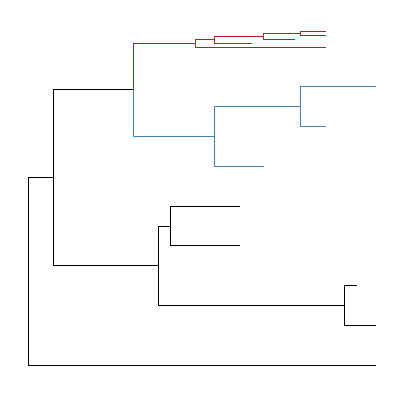
从上图可以看到的是,三个图的“横坐标”范围不一样,第一个图是原始的分支单位,第二个是以dN进行标准化的结果,第三个是以rate进行标准化的结果。

子集操作

从树中除去tips

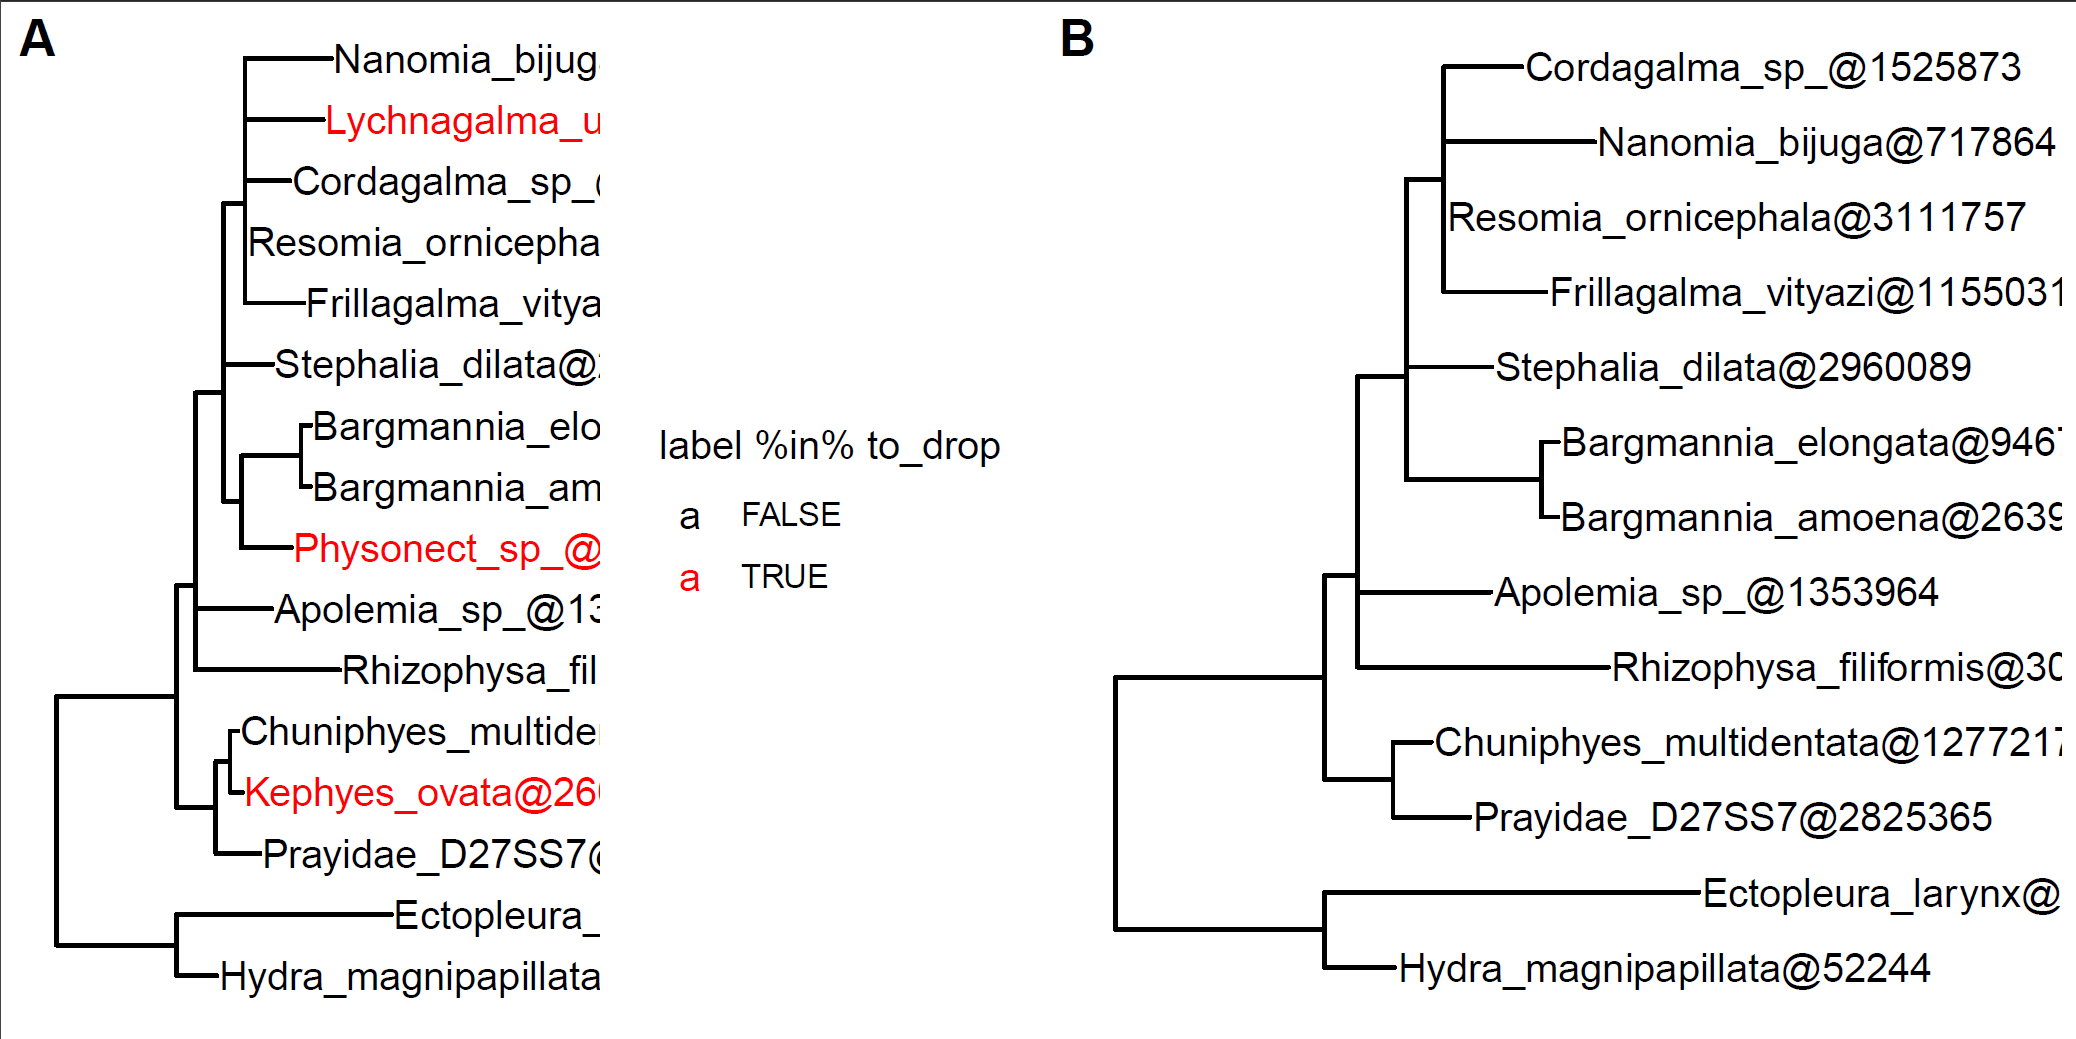
有些时候出于某些原因(如序列质量、组装质量、比对错误等),我们会将某些tips(样本)从树里面剔除,函数drop.tip()可以实现这一功能:

1
2
3
4
5
6
7
8
9
10
11
f <- system.file("extdata/NHX", "phyldog.nhx", package="treeio")
nhx <- read.nhx(f)
to_drop <- c("Physonect_sp_@2066767",
"Lychnagalma_utricularia@2253871",
"Kephyes_ovata@2606431")
p1 <- ggtree(nhx) + geom_tiplab(aes(color = label %in% to_drop)) +
scale_color_manual(values=c("black", "red")) + xlim(0, 0.8)

nhx_reduced <- drop.tip(as.phylo(nhx), to_drop) # 发现需要转换成phylo对象才行
p2 <- ggtree(nhx_reduced) + geom_tiplab() + xlim(0, 0.8)
cowplot::plot_grid(p1, p2, ncol=2, labels = c("A", "B"))

根据tips取子集

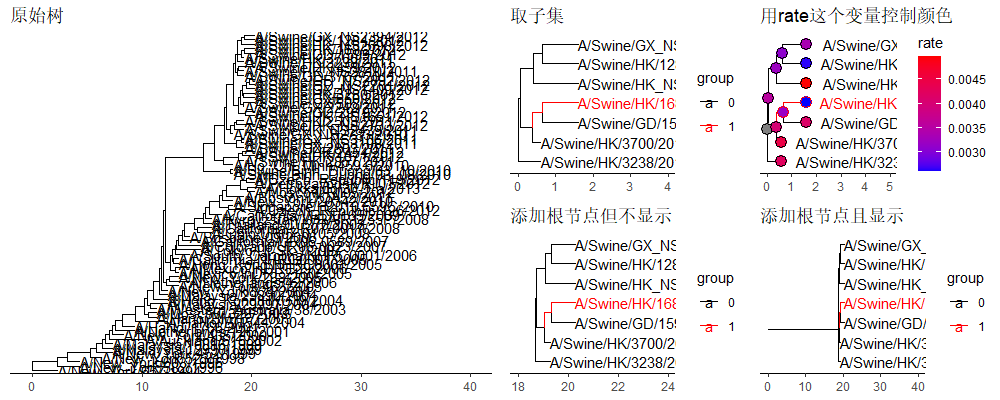
如果一个进化树很复杂的话,要看我们感兴趣的部分就很难,这时候就需要将我们感兴趣的部分提取出来。treeio中的函数tree_subset()能够完成这一功能,即使是提取出来的子集,结构还是和原来的一样,不会发生变化。

1
2
3
4
5
6
7
8
9
10
11
12
13
14
15
16
17
18
19
20
21
22
23
24
25
26
27
28
29
30
31
32
33
34
35
36
37
38
39
beast_file <- system.file("examples/MCC_FluA_H3.tree", package="ggtree")
beast_tree <- read.beast(beast_file)

p1 = ggtree(beast_tree) +
geom_tiplab() +
ggtitle('原始树') +
xlim(0, 40) + theme_tree2()

tree2 = tree_subset(beast_tree, "A/Swine/HK/168/2012", levels_back=4)
p2 <- ggtree(tree2, aes(color=group)) +
ggtitle('取子集') +
scale_color_manual(values = c("black", "red")) +
geom_tiplab() + xlim(0, 4) + theme_tree2()

p3 <- ggtree(tree2, aes(color=group)) +
geom_tiplab(hjust = -.1) + xlim(0, 5) +
geom_point(aes(fill = rate), shape = 21, size = 4) +
ggtitle('用rate这个变量控制颜色') +
scale_color_manual(values = c("black", "red"), guide = FALSE) +
scale_fill_continuous(low = 'blue', high = 'red') +
theme_tree2() + theme(legend.position = 'right')


p4 <- ggtree(tree2, aes(color=group),
root.position = as.phylo(tree2)$root.edge) +
geom_tiplab() + xlim(18, 24) +
ggtitle('添加根节点但不显示') +
scale_color_manual(values = c("black", "red")) +
theme_tree2()

p5 <- ggtree(tree2, aes(color=group),
root.position = as.phylo(tree2)$root.edge) +
geom_rootedge() + geom_tiplab() + xlim(0, 40) +
ggtitle('添加根节点且显示') +
scale_color_manual(values = c("black", "red")) +
theme_tree2()

plot_grid(p2, p3, p4, p5, ncol=2) %>%
plot_grid(p1, ., ncol=2)

根据内部节点编号取子集

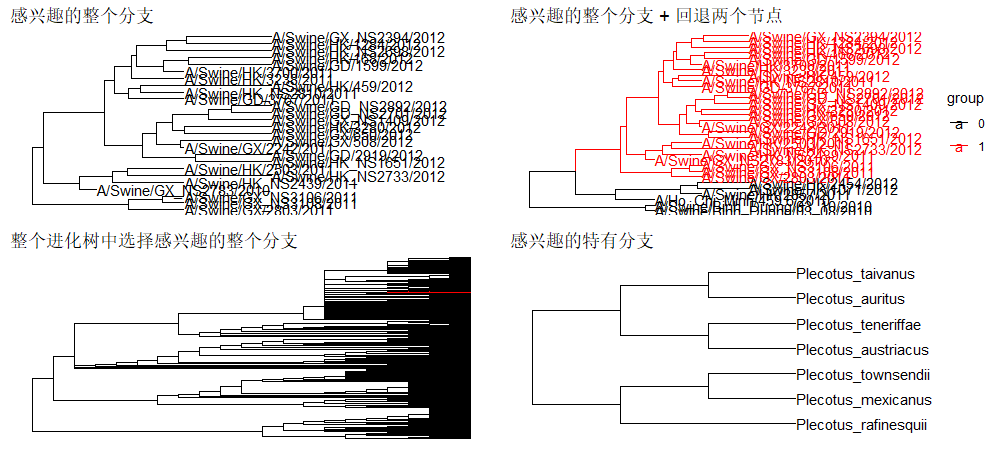
如果我们对特定的进化分支(clade)感兴趣,那也可以通过tree_subset()函数将感兴趣的分支进行放大展示,但是这个时候需要我们知道感兴趣的进化分支所对应的node编号才行。

1
2
3
4
5
6
7
8
9
10
11
12
13
14
15
16
17
18
19
20
21
22
23
24
25
26
27
28
29
30
31
32
clade <- tree_subset(beast_tree, node=121, levels_back=0)
clade2 <- tree_subset(beast_tree, node=121, levels_back=2)
p1 <- ggtree(clade) +
ggtitle('感兴趣的整个分支') +
geom_tiplab() + xlim(0, 5)
p2 <- ggtree(clade2, aes(color=group)) +
ggtitle('感兴趣的整个分支 + 回退两个节点') +
geom_tiplab() +
xlim(0, 8) + scale_color_manual(values=c("black", "red"))


library(ape)
library(tidytree)
library(treeio)
data(chiroptera)

# 如果不知道node的时候,就直接进行匹配
nodes <- grep("Plecotus", chiroptera$tip.label)
chiroptera <- groupOTU(chiroptera, nodes)

p3 <- ggtree(chiroptera, aes(colour = group)) +
ggtitle('整个进化树中选择感兴趣的整个分支') +
scale_color_manual(values=c("black", "red")) +
theme(legend.position = "none")

clade <- MRCA(chiroptera, nodes) # 最近的父节点
x <- tree_subset(chiroptera, clade, levels_back = 0)
p4 <- ggtree(x) +
ggtitle('感兴趣的特有分支') +
geom_tiplab() + xlim(0, 5)

plot_grid(p1, p2, p3, p4,ncol=2)

导出数据

treeio这个R包可以导出多种格式的文件,这个比较简单,详情参照:https://yulab-smu.top/treedata-book/chapter3.html

进化树可视化

基础方法

ggtree对进化树进行可视化的方法有两种:

  • ggplot() + geom_tree() + theme_tree()
  • ggtree()

第二种方法是第一种方法的“缩写版”。

1
2
3
4
5
6
7
8
library(treeio)
library(ggtree)

nwk <- system.file("extdata", "sample.nwk", package="treeio")
tree <- read.tree(nwk)

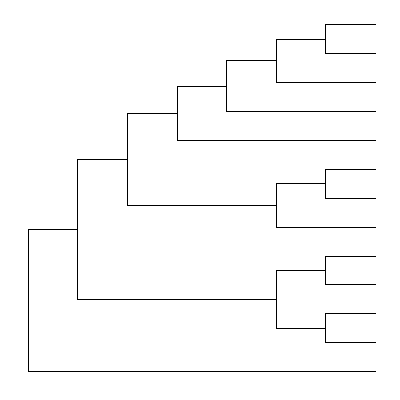
ggplot(tree, aes(x, y)) + geom_tree() + theme_tree()
ggtree(tree)

这两种方法得到的结果是一样的:

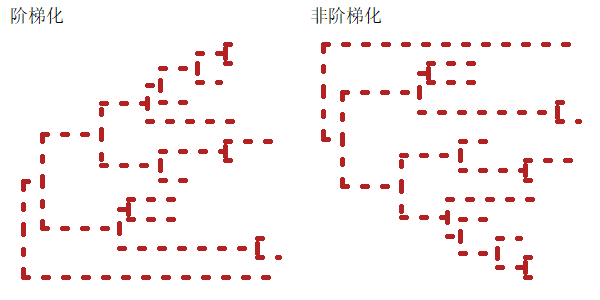
ggtree支持ggplot2的图形语法,因此,也可以在ggtree中对颜色性状等进行修改:

1
2
3
4
5
6
7
8
9
10
11
12
13
14
15
16
library(ggplot2)
library(treeio)
library(ggtree)

nwk <- system.file("extdata", "sample.nwk", package="treeio")
tree <- read.tree(nwk)

ggplot(tree, aes(x, y)) + geom_tree() + theme_tree()
ggtree(tree)

p1 = ggtree(tree, color="firebrick", size=2, linetype="dotted") +
ggtitle('阶梯化')
p2 = ggtree(tree, color="firebrick", size=2, linetype="dotted", ladderize=FALSE) +
ggtitle('非阶梯化')

cowplot::plot_grid(p1,p2)v

可以使用参数branch.length对egde进行标准化,如果参数为none,则是这样:

1
ggtree(tree, branch.length="none")

输出样式

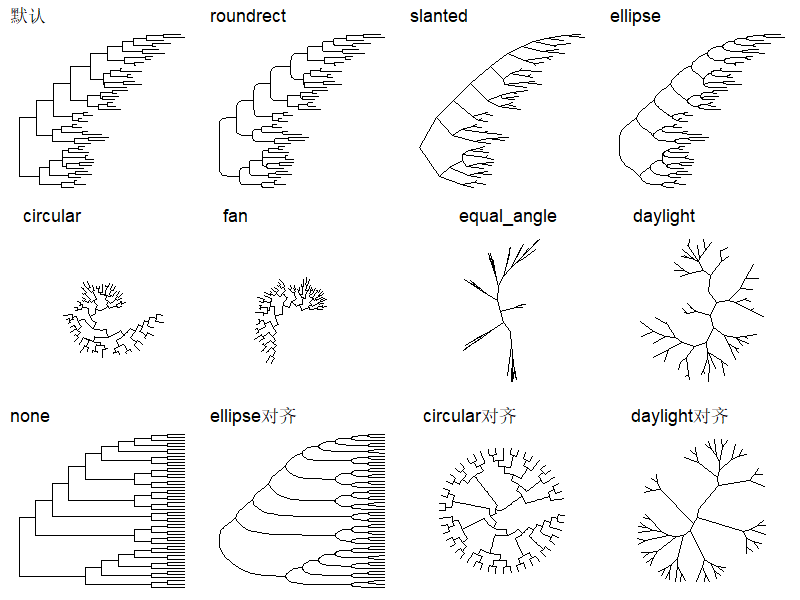
ggtree支持多种输出样式:

1
2
3
4
5
6
7
8
9
10
11
12
13
14
15
16
17
18
19
20
21
22
23
24
25
26
27
28
29
library(ggtree)
set.seed(2017-02-16)
tree <- rtree(50)
p1 = ggtree(tree) +
ggtitle('默认')
p2 = ggtree(tree, layout="roundrect") +
ggtitle('roundrect')
p3 = ggtree(tree, layout="slanted") +
ggtitle('slanted')
p4 = ggtree(tree, layout="ellipse") +
ggtitle('ellipse')
p5 = ggtree(tree, layout="circular") +
ggtitle('circular')
p6 = ggtree(tree, layout="fan", open.angle=120) +
ggtitle('fan')
p7 = ggtree(tree, layout="equal_angle") +
ggtitle('equal_angle')
p8 = ggtree(tree, layout="daylight") +
ggtitle('daylight')
p9 = ggtree(tree, branch.length='none') +
ggtitle('none')
p10 = ggtree(tree, layout="ellipse", branch.length="none") +
ggtitle('ellipse对齐')
p11 = ggtree(tree, branch.length='none', layout='circular') +
ggtitle('circular对齐')
p12 = ggtree(tree, layout="daylight", branch.length = 'none') +
ggtitle('daylight对齐')

cowplot::plot_grid(p1,p2,p3,p4,p5,p6,p7,p8,p9,p10,p11,p12, ncol = 4)

当只是展示树结构而没有分支长度标尺的时候,就用最下面这4种。

还有其他的多种对齐方式:

1
2
3
4
5
6
7
8
9
ggtree(tree) + scale_x_reverse()
ggtree(tree) + coord_flip()
ggtree(tree) + layout_dendrogram()
ggplotify::as.ggplot(ggtree(x), angle=-30, scale=.9)
ggtree(tree, layout='slanted') + coord_flip()
ggtree(tree, layout='slanted', branch.length='none') + layout_dendrogram()
ggtree(tree, layout='circular') + xlim(-10, NA)
ggtree(tree) + layout_inward_circular()
ggtree(tree) + layout_inward_circular(xlim=15)

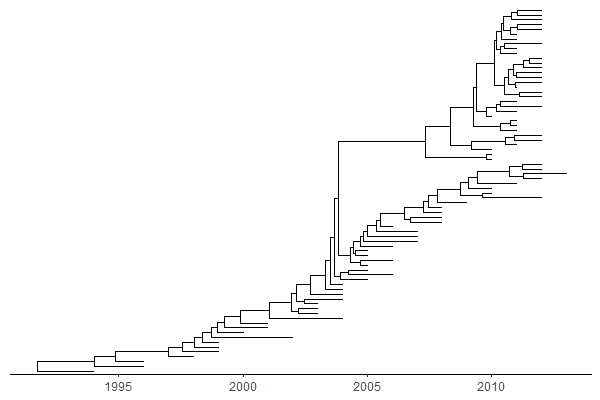
如果是时间范围数据的话,则需要调用参数mrsd(most recent sample data):

1
2
3
4
beast_file <- system.file("examples/MCC_FluA_H3.tree", 
package="ggtree")
beast_tree <- read.beast(beast_file)
ggtree(beast_tree, mrsd="2013-01-01") + theme_tree2()

展示相关元素

展示进化距离

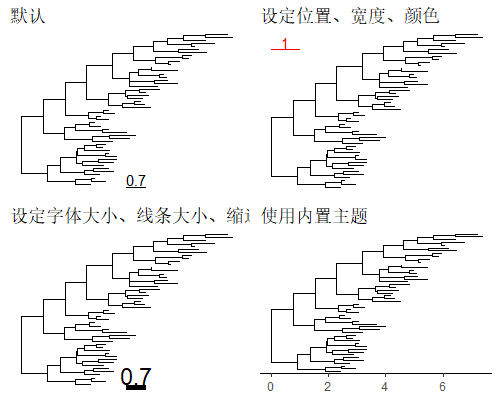
函数geom_treescale()用于展示进化距离。

1
2
3
4
5
6
7
8
9
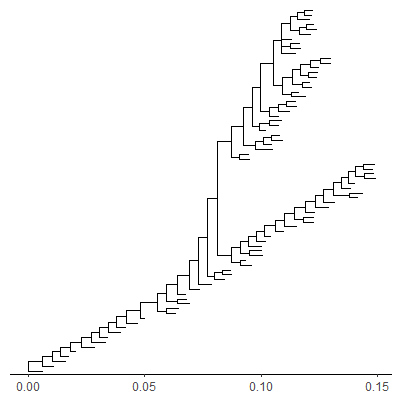
p1 = ggtree(tree) + geom_treescale() + ggtitle('默认')
p2 = ggtree(tree) + geom_treescale(x=0, y=45, width=1, color='red') +
ggtitle('设定位置、宽度、颜色')
p3 = ggtree(tree) + geom_treescale(fontsize=6, linesize=2, offset=1) +
ggtitle('设定字体大小、线条大小、缩进')
p4 = ggtree(tree) + theme_tree2() +
ggtitle('使用内置主题')

cowplot::plot_grid(p1,p2,p3,p4, ncol = 2)

展示nodes/tips

1
2
3
4
5
6
7
8
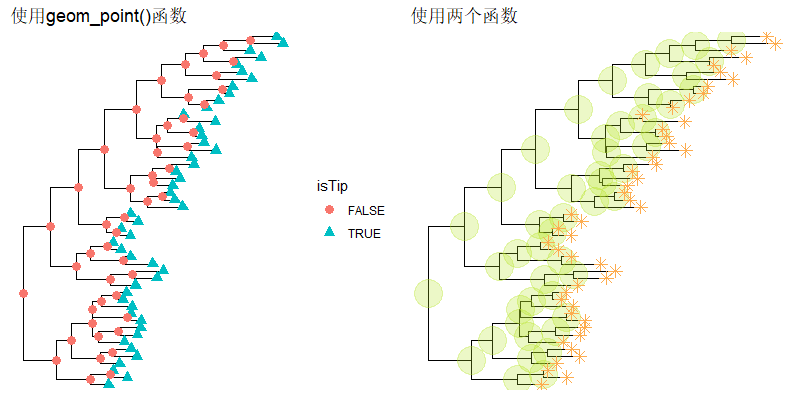
p1 = ggtree(tree) + geom_point(aes(shape=isTip, color=isTip), size=3) +
ggtitle('使用geom_point()函数')

p2 <- ggtree(tree) + geom_nodepoint(color="#b5e521", alpha=1/4, size=10) +
geom_tippoint(color="#FDAC4F", shape=8, size=3) +
ggtitle('使用两个函数')

cowplot::plot_grid(p1,p2, ncol = 2)

展示tips的标签

1
2
3
4
5
6
7
8
9
10
11
p1 = ggtree(tree) + geom_nodepoint(color="#b5e521", alpha=1/4, size=10) +
geom_tippoint(color="#FDAC4F", shape=8, size=3) +
geom_tiplab(size=3, color="purple")

p2 = ggtree(tree, layout="circular") +
geom_tiplab(aes(angle=angle), color='blue')

p3 = ggtree(tree, branch.length = 'none') +
geom_tiplab(as_ylab=TRUE, color='firebrick')

cowplot::plot_grid(p1, p2,p3, ncol = 3)

展示根节点

1
2
3
4
5
6
7
8
9
10
11
12
13
14
15
16
17
18
19
20
21
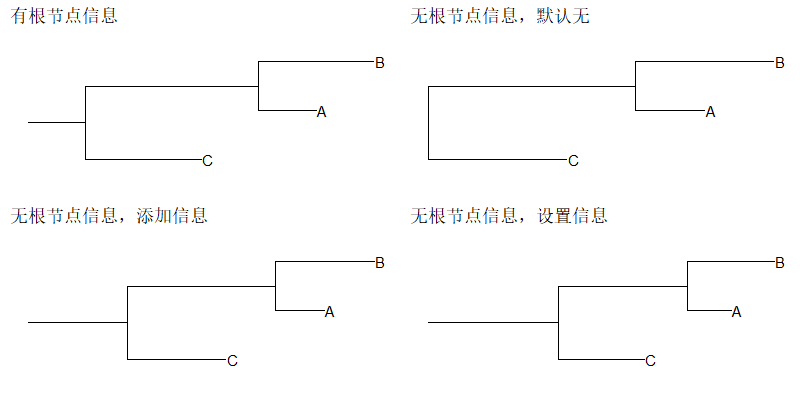
## with root edge = 1
tree1 <- read.tree(text='((A:1,B:2):3,C:2):1;')
p1 = ggtree(tree1) + geom_tiplab() + geom_rootedge() +
ggtitle('有根节点信息')

## without root edge
tree2 <- read.tree(text='((A:1,B:2):3,C:2);')
p2 = ggtree(tree2) + geom_tiplab() + geom_rootedge() +
ggtitle('无根节点信息,默认无')

## setting root edge
tree2$root.edge <- 2
p3 = ggtree(tree2) + geom_tiplab() + geom_rootedge() +
ggtitle('无根节点信息,添加信息')

## specify length of root edge for just plotting
## this will ignore tree$root.edge
p4 = ggtree(tree2) + geom_tiplab() + geom_rootedge(rootedge = 3) +
ggtitle('无根节点信息,设置信息')

cowplot::plot_grid(p1,p2,p3,p4, ncol = 2)

上色

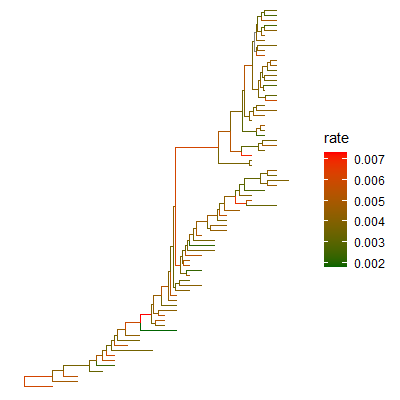
上色直接是很简单,就像ggplot2那样:

1
2
3
ggtree(beast_tree, aes(color=rate)) +
scale_color_continuous(low='darkgreen', high='red') +
theme(legend.position="right")

1
2
3
4
5
6
7
8
9
10
11
12
13
14
15
16
17
18
19
20
21
22
23
24
25
26
27
28
29
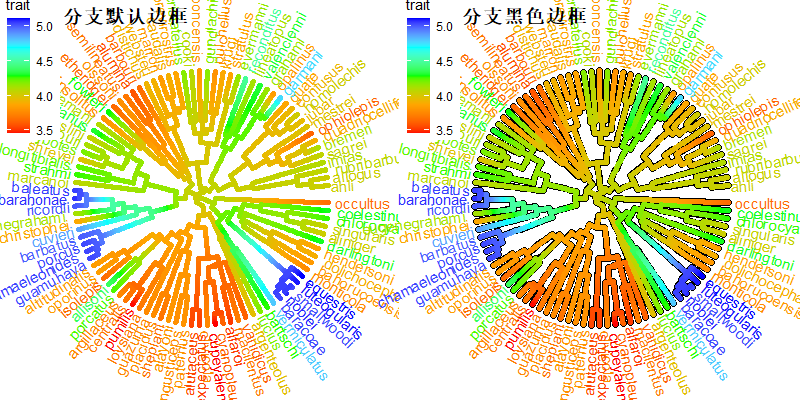
anole.tree<-read.tree("http://www.phytools.org/eqg2015/data/anole.tre")
svl <- read.csv("http://www.phytools.org/eqg2015/data/svl.csv",
row.names=1)
svl <- as.matrix(svl)[,1]
fit <- phytools::fastAnc(anole.tree,svl,vars=TRUE,CI=TRUE)

td <- data.frame(node = nodeid(anole.tree, names(svl)),
trait = svl)
nd <- data.frame(node = names(fit$ace), trait = fit$ace)

d <- rbind(td, nd)
d$node <- as.numeric(d$node)
tree <- full_join(anole.tree, d, by = 'node')

p1 <- ggtree(tree, aes(color=trait), layout = 'circular',
ladderize = FALSE, continuous = TRUE, size=2) +
scale_color_gradientn(colours=c("red", 'orange', 'green', 'cyan', 'blue')) +
geom_tiplab(hjust = -.1) +
xlim(0, 1.2) +
theme(legend.position = c(.05, .85))

p2 <- ggtree(tree, layout='circular', ladderize = FALSE, size=2.8) +
geom_tree(aes(color=trait), continuous=T, size=2) +
scale_color_gradientn(colours=c("red", 'orange', 'green', 'cyan', 'blue')) +
geom_tiplab(aes(color=trait), hjust = -.1) +
xlim(0, 1.2) +
theme(legend.position = c(.05, .85))

cowplot::plot_grid(p1, p2, ncol=2, labels=c("分支默认边框", "分支黑色边框"))

对树进行重新标准化

多个参数对进化树进行标准化,时间序列相关的参数用msrd,其余的参数可以用branch.length

1
2
3
4
5
6
7
8
9
10
11
12
13
14
15
16
17
18
library(treeio)
beast_file <- system.file("examples/MCC_FluA_H3.tree", package="ggtree")
beast_tree <- read.beast(beast_file)
beast_tree

p1 <- ggtree(beast_tree, mrsd='2013-01-01') + theme_tree2() +
labs(caption="时间序列")
p2 <- ggtree(beast_tree, branch.length='rate') + theme_tree2() +
labs(caption="取代速率")

mlcfile <- system.file("extdata/PAML_Codeml", "mlc", package="treeio")
mlc_tree <- read.codeml_mlc(mlcfile)
p3 <- ggtree(mlc_tree) + theme_tree2() +
labs(caption="单密码子核苷酸取代")
p4 <- ggtree(mlc_tree, branch.length='dN_vs_dS') + theme_tree2() +
labs(caption="dN/dS")

cowplot::plot_grid(p1,p2,p3,p4, ncol = 2

也可以用rescale_tree对树进行标准化:

1
2
beast_tree2 <- rescale_tree(beast_tree, branch.length='rate')
ggtree(beast_tree2) + theme_tree2()

背景色

1
2
3
4
5
6
set.seed(2019)
x <- rtree(30)
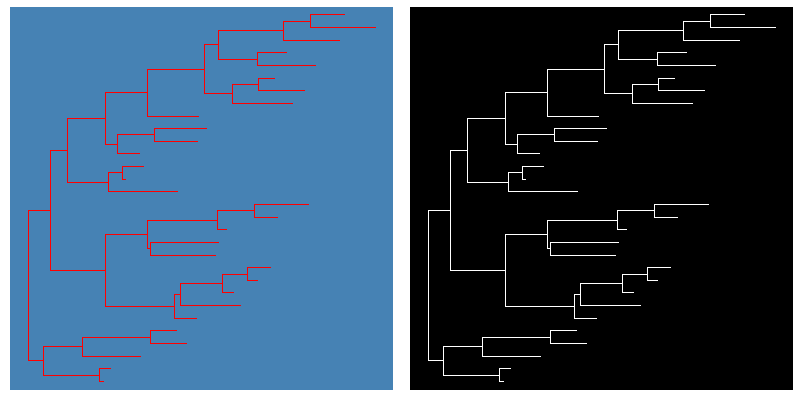
p1 = ggtree(x, color="red") + theme_tree("steelblue")
p2 = ggtree(x, color="white") + theme_tree("black")

cowplot::plot_grid(p1,p2, ncol = 1)

批量建树

批量建树就相当于ggplot2中的分面:

1
2
3
4
5
6
## trees <- lapply(c(10, 20, 40), rtree)
## class(trees) <- "multiPhylo"
## ggtree(trees) + facet_wrap(~.id, scale="free") + geom_tiplab()

r8s <- read.r8s(system.file("extdata/r8s", "H3_r8s_output.log", package="treeio"))
ggtree(r8s) + facet_wrap( ~.id, scale="free") + theme_tree2()

进化树注释

基本用法

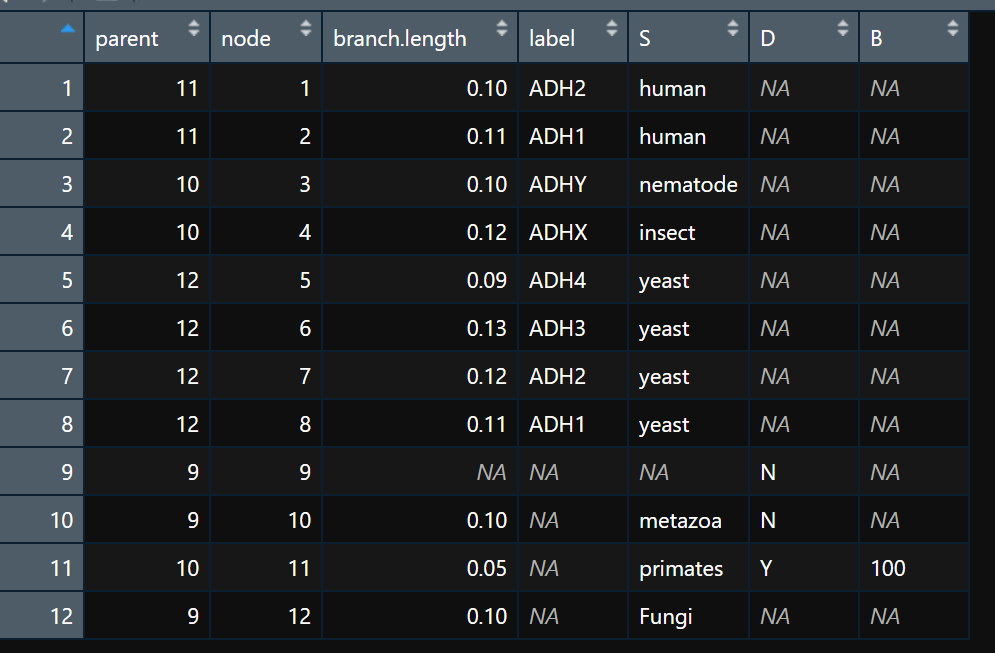
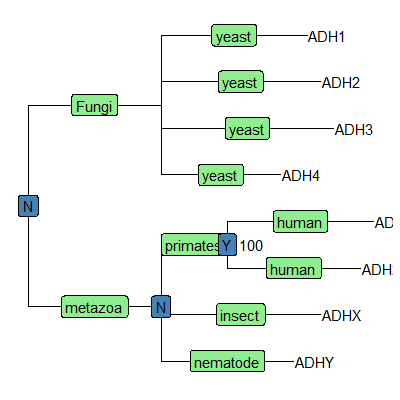
注释的信息很多,节点的分组、样品来源、基因表达量等都可以作为注释的信息。一个简单的例子:

1
2
3
4
5
6
7
8
9
10
11
12
library(ggtree)
treetext = "(((ADH2:0.1[&&NHX:S=human], ADH1:0.11[&&NHX:S=human]):
0.05 [&&NHX:S=primates:D=Y:B=100],ADHY:
0.1[&&NHX:S=nematode],ADHX:0.12 [&&NHX:S=insect]):
0.1[&&NHX:S=metazoa:D=N],(ADH4:0.09[&&NHX:S=yeast],
ADH3:0.13[&&NHX:S=yeast], ADH2:0.12[&&NHX:S=yeast],
ADH1:0.11[&&NHX:S=yeast]):0.1[&&NHX:S=Fungi])[&&NHX:D=N];"
tree <- read.nhx(textConnection(treetext))
ggtree(tree) + geom_tiplab() +
geom_label(aes(x=branch, label=S), fill='lightgreen') +
geom_label(aes(label=D), fill='steelblue') +
geom_text(aes(label=B), hjust=-.5)

clade注释

1
2
3
4
5
6
7
8
9
10
11
12
13
14
15
16
set.seed(2015-12-21)
tree <- rtree(30)
p1 <- ggtree(tree) + xlim(NA, 6)

p2 = p1 + geom_cladelabel(node=45, label="test label") +
geom_cladelabel(node=34, label="another clade")

p3 = p1 + geom_cladelabel(node=45, label="test label", align=TRUE, offset = .2, color='red') +
geom_cladelabel(node=34, label="another clade", align=TRUE, offset = .2, color='blue')

p4 = p1 + geom_cladelabel(node=45, label="test label", align=T, angle=270, hjust='center', offset.text=.5, barsize=1.5) +
geom_cladelabel(node=34, label="another clade", align=T, angle=45, fontsize=8)

p5 = p1 + geom_cladelabel(node=34, label="another clade", align=T, geom='label', fill='lightblue')

cowplot::plot_grid(p2,p3,p4,p5,ncol = 2)

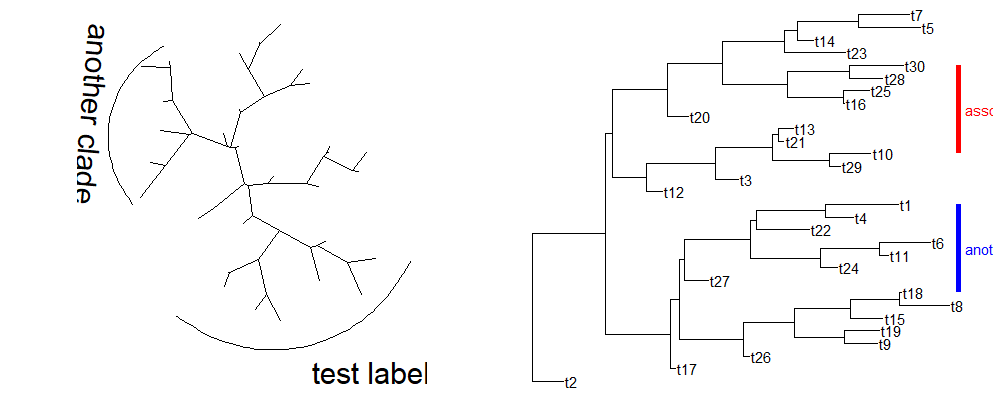
同样也适用于无根输出样式,可以根据node的编号,也可以直接用tips的标签(这个是真的赞啊):

1
2
3
4
5
6
7
8
9
10
11
12
13
14
15
p1 = ggtree(tree, layout="daylight") + 
geom_cladelabel(node=35, label="test label", angle=0,
fontsize=8, offset=.5, vjust=.5) +
geom_cladelabel(node=55, label='another clade',
angle=-95, hjust=.5, fontsize=8)


p2 = ggtree(tree) + xlim(NA, 6) +
geom_tiplab() +
geom_strip('t10', 't30', barsize=2, color='red',
label="associated taxa", offset.text=.1) +
geom_strip('t1', 't18', barsize=2, color='blue',
label = "another label", offset.text=.1)

cowplot::plot_grid(p1,p2,ncol = 2)

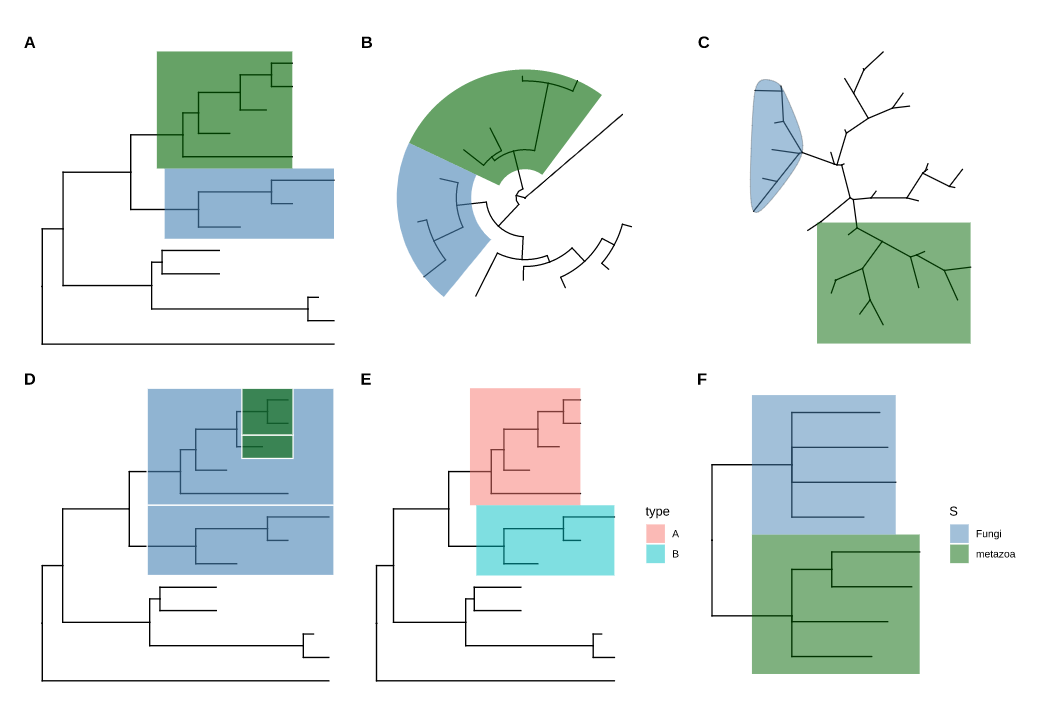
局部高亮

局部高亮可以根据node编号进行高亮,也可以使用附加数据或树数据里面的数据进行高亮:

1
2
3
4
5
6
7
8
9
10
11
12
13
14
15
16
17
18
19
20
21
22
23
24
25
26
27
28
29
30
nwk <- system.file("extdata", "sample.nwk", package="treeio")
tree <- read.tree(nwk)

p1 = ggtree(tree) +
geom_hilight(node=21, fill="steelblue", alpha=.6) +
geom_hilight(node=17, fill="darkgreen", alpha=.6)

p2 = ggtree(tree, layout="circular") +
geom_hilight(node=21, fill="steelblue", alpha=.6) +
geom_hilight(node=23, fill="darkgreen", alpha=.6)

## type can be 'encircle' or 'rect'
ggtree(tree, layout="daylight", branch.length = 'none') +
geom_hilight(node=10) +
geom_hilight(node=16, fill='darkgreen', type="rect")


ggtree(tree) +
geom_balance(node=16, fill='steelblue', color='white', alpha=0.6, extend=1) +
geom_balance(node=19, fill='darkgreen', color='white', alpha=0.6, extend=1)

## using external data
d <- data.frame(node=c(17, 21), type=c("A", "B"))
ggtree(tree) + geom_hilight(data=d, aes(node=node, fill=type))

## using data stored in tree object
x <- read.nhx(system.file("extdata/NHX/ADH.nhx", package="treeio"))
ggtree(x) +
geom_hilight(mapping=aes(subset = node %in% c(10, 12), fill = S)) +
scale_fill_manual(values=c("steelblue", "darkgreen"))

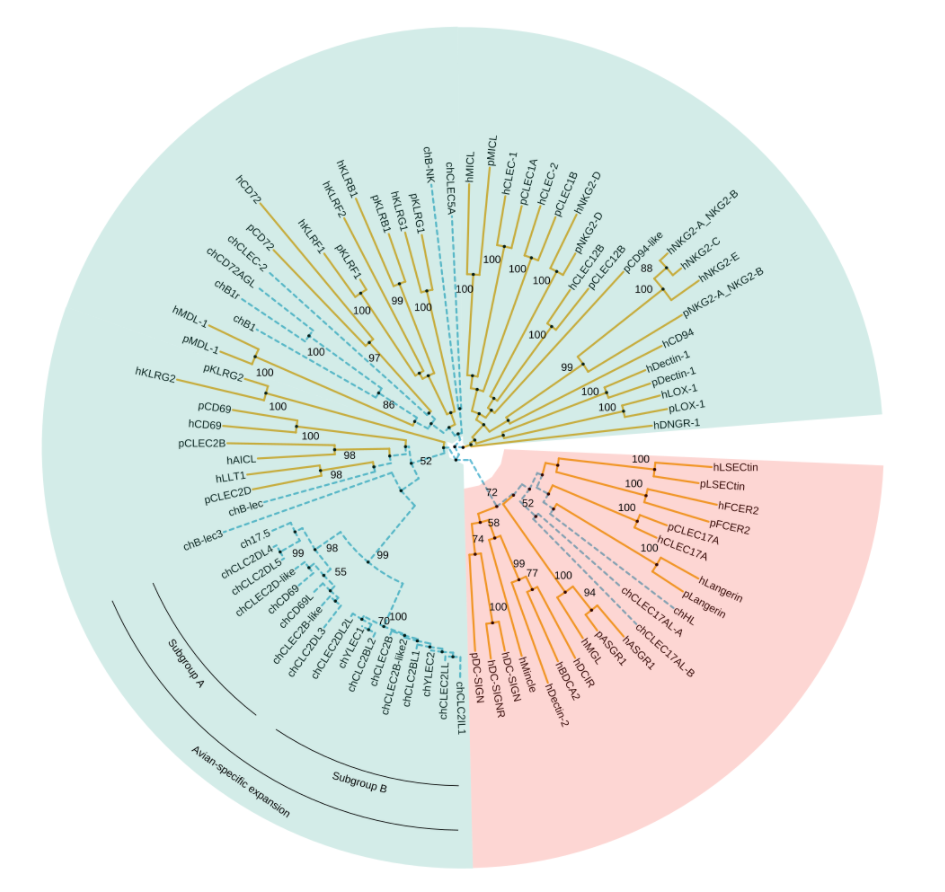
高亮不同分组

1
2
3
4
5
6
7
8
9
10
11
12
13
14
15
16
17
18
19
20
21
22
23
24
25
26
27
28
29
30
31
32
33
34
35
36
37
38
39
40
41
42
43
44
45
46
47
mytree <- read.tree("data/Tree 30.4.19.nwk")

# Define nodes for coloring later on
tiplab <- mytree$tip.label
cls <- tiplab[grep("^ch", tiplab)]
labeltree <- groupOTU(mytree, cls)

p <- ggtree(labeltree, aes(color=group, linetype=group), layout="circular") +
scale_color_manual(values = c("#efad29", "#63bbd4")) +
geom_nodepoint(color="black", size=0.1) +
geom_tiplab(size=2, color="black")

p2 <- flip(p, 136, 110) %>%
flip(141, 145) %>%
rotate(141) %>%
rotate(142) %>%
rotate(160) %>%
rotate(164) %>%
rotate(131)

### Group V and II coloring
p3 <- p2 + geom_hilight(node = 110, fill = "#229f8a", alpha = 0.2, extend = 0.43) +
geom_hilight(node = 88, fill = "#229f8a", alpha = 0.2, extend = 0.445) +
geom_hilight(node = 156, fill = "#229f8a", alpha = 0.2, extend = 0.35) +
geom_hilight(node = 136, fill = "#f9311f", alpha = 0.2, extend = 0.512)

### Putting on a label on the avian specific expansion
p4 <- p3 + geom_cladelabel(node = 113, label = "Avian-specific expansion",
align = TRUE, angle = -35, offset.text = 0.05,
hjust = "center", fontsize = 2, offset = 0.2, barsize = 0.2)

### Adding the bootstrap values with subset used to remove all bootstraps < 50
p5 <- p4 + geom_text2(aes(label=label,
subset = !is.na(as.numeric(label)) & as.numeric(label) > 50),
size = 2, color = "black",nudge_y = 0.7, nudge_x = -0.05)

### Putting labels on the subgroups
p6 <- p5 + geom_cladelabel(node = 114, label = "Subgroup A", align = TRUE,
angle = -55, offset.text = .03, hjust = "center",
offset = 0.05, barsize = 0.2, fontsize = 2) +
geom_cladelabel(node = 121, label = "Subgroup B", align = TRUE,
angle = -15, offset.text = .03, hjust = "center",
offset = 0.05, barsize = 0.2, fontsize = 2) +
theme(legend.position="none",
plot.margin=grid::unit(c(-15,-15,-15,-15), "mm"))

print(p6)

样品连接

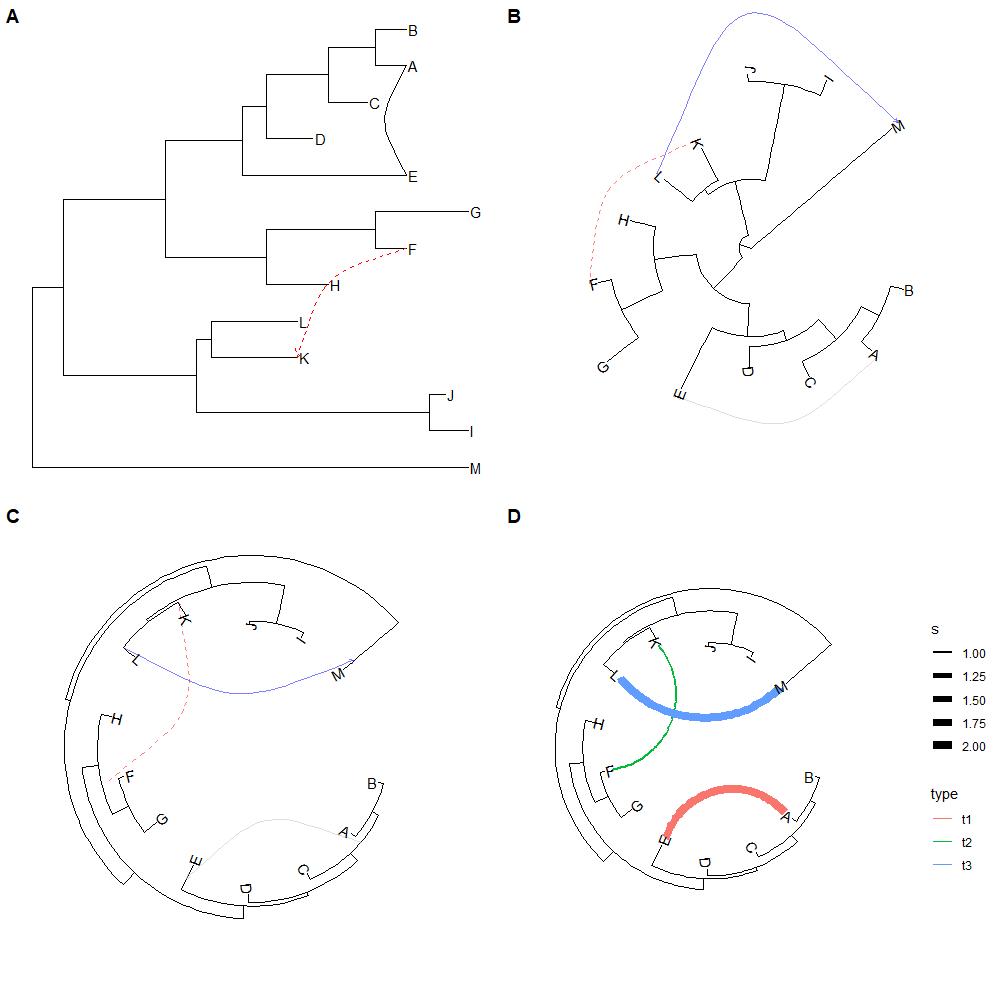
利用函数geom_taxalink()可以实现样品之间的连线,但是只支持有限的几种形式:

1
2
3
4
5
6
7
8
9
10
11
12
13
14
15
16
17
18
19
20
21
22
23
24
25
26
27
28
29
30
31
32
33
34
35
36
37
38
39
40
41
42
43
44
45
46
47
48
49
50
51
52
53
54
55
56
p1 <- ggtree(tree) + geom_tiplab() + 
geom_taxalink(taxa1='A', taxa2='E') +
geom_taxalink(taxa1='F', taxa2='K',
color='red', linetype = 'dashed',
arrow=arrow(length=unit(0.02, "npc")))

p2 <- ggtree(tree, layout="circular") +
geom_taxalink(taxa1='A', taxa2='E',
color="grey",alpha=0.5,
offset=0.05,arrow=arrow(length=unit(0.01, "npc"))) +
geom_taxalink(taxa1='F', taxa2='K',
color='red', linetype = 'dashed',
alpha=0.5, offset=0.05,
arrow=arrow(length=unit(0.01, "npc"))) +
geom_taxalink(taxa1="L", taxa2="M",
color="blue", alpha=0.5,
offset=0.05,hratio=0.8,
arrow=arrow(length=unit(0.01, "npc"))) +
geom_tiplab()

# when the tree was created using reverse x,
# we can set outward to FALSE, which will generate the inward curve lines.
p3 <- ggtree(tree, layout="inward_circular", xlim=150) +
geom_taxalink(taxa1='A', taxa2='E',
color="grey", alpha=0.5,
offset=-0.2,
outward=FALSE,
arrow=arrow(length=unit(0.01, "npc"))) +
geom_taxalink(taxa1='F', taxa2='K',
color='red', linetype = 'dashed',
alpha=0.5, offset=-0.2,
outward=FALSE,
arrow=arrow(length=unit(0.01, "npc"))) +
geom_taxalink(taxa1="L", taxa2="M",
color="blue", alpha=0.5,
offset=-0.2,
outward=FALSE,
arrow=arrow(length=unit(0.01, "npc"))) +
geom_tiplab(hjust=1)

dat <- data.frame(from=c("A", "F", "L"),
to=c("E", "K", "M"),
h=c(1, 1, 0.1),
type=c("t1", "t2", "t3"),
s=c(2, 1, 2))
p4 <- ggtree(tree, layout="inward_circular", xlim=c(150, 0)) +
geom_taxalink(data=dat,
mapping=aes(taxa1=from,
taxa2=to,
color=type,
size=s),
ncp=10,
offset=0.15) +
geom_tiplab(hjust=1) +
scale_size_continuous(range=c(1,3))
cowplot::plot_grid(p1, p2, p3, p4, ncol=2, labels=LETTERS[1:4])

Uncertainty of evolutionary inference

1
2
3
4
5
6
7
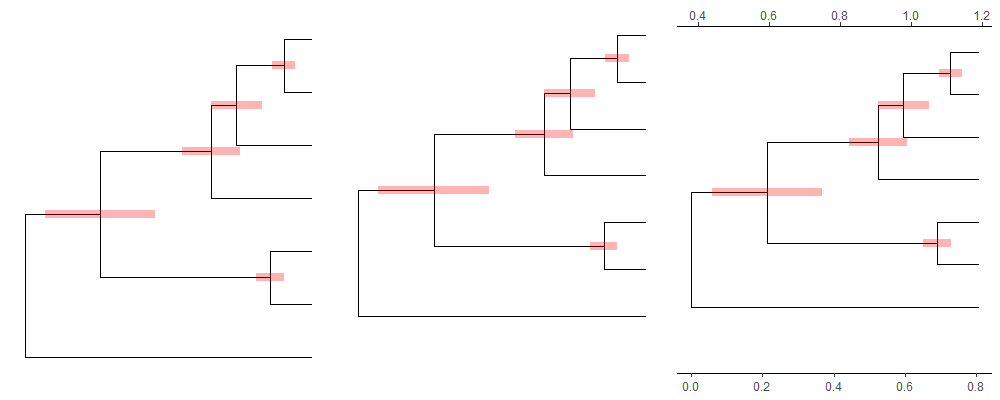
file <- system.file("extdata/MEGA7", "mtCDNA_timetree.nex", package = "treeio")
x <- read.mega(file)
p1 <- ggtree(x) + geom_range('reltime_0.95_CI', color='red', size=3, alpha=.3)
p2 <- ggtree(x) + geom_range('reltime_0.95_CI', color='red', size=3, alpha=.3, center='reltime')
p3 <- p2 + scale_x_range() + theme_tree2()

cowplot::plot_grid(p1,p2,p3,ncol = 3)

其他软件输出的结果

1
2
3
4
5
6
7
8
9
10
11
12
13
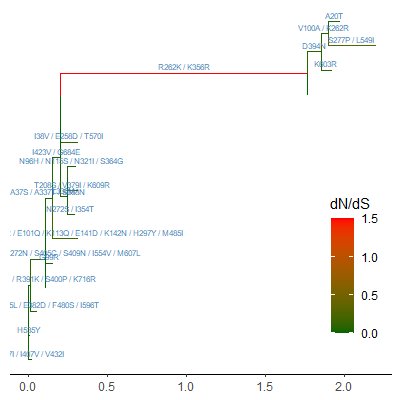
rstfile <- system.file("extdata/PAML_Codeml", "rst", 
package="treeio")
mlcfile <- system.file("extdata/PAML_Codeml", "mlc",
package="treeio")

ml <- read.codeml(rstfile, mlcfile)
ggtree(ml, aes(color=dN_vs_dS), branch.length='dN_vs_dS') +
scale_color_continuous(name='dN/dS', limits=c(0, 1.5),
oob=scales::squish,
low='darkgreen', high='red') +
geom_text(aes(x=branch, label=AA_subs),
vjust=-.5, color='steelblue', size=2) +
theme_tree2(legend.position=c(.9, .3))

放大特定区域

1
2
3
4
5
6
7
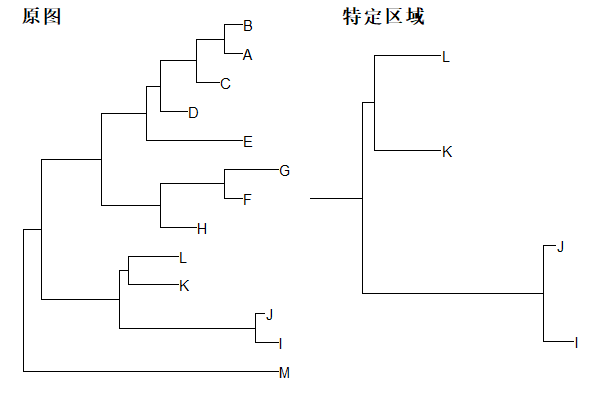
library(ggtree)
nwk <- system.file("extdata", "sample.nwk", package="treeio")
tree <- read.tree(nwk)
p1 = ggtree(tree) + geom_tiplab()
p2 = viewClade(p, MRCA(p, "I", "L"))

cowplot::plot_grid(p1,p2,ncol = 2, labels = c('原图','特定区域'))

标准化选中的clade

1
2
3
4
tree2 <- groupClade(tree, c(17, 21))
p <- ggtree(tree2, aes(color=group)) + theme(legend.position='none') +
scale_color_manual(values=c("black", "firebrick", "steelblue"))
scaleClade(p, node=17, scale=.1)

隐藏/展示某个clade

1
2
3
4
5
6
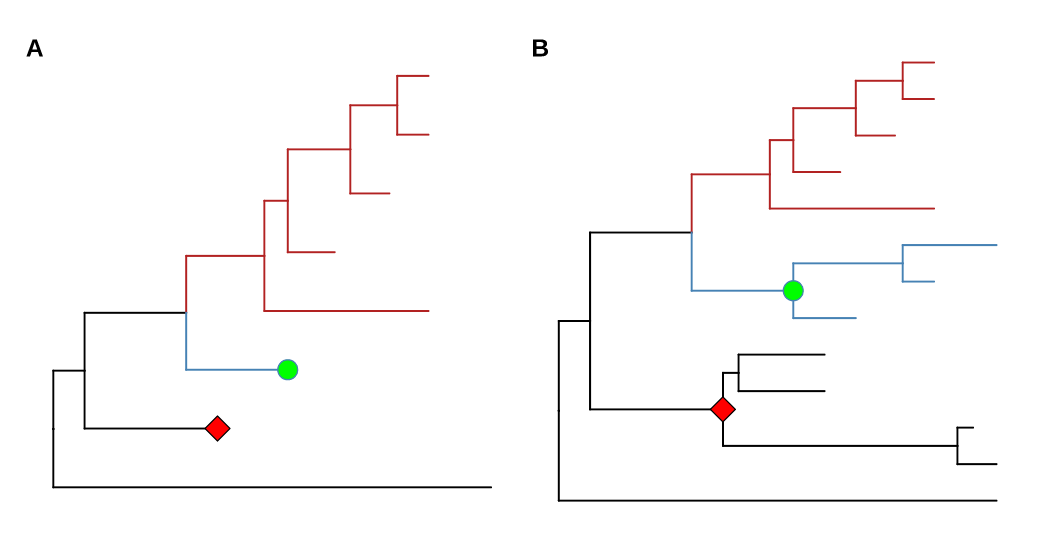
p2 <- p %>% collapse(node=21) + 
geom_point2(aes(subset=(node==21)), shape=21, size=5, fill='green')
p2 <- collapse(p2, node=23) +
geom_point2(aes(subset=(node==23)), shape=23, size=5, fill='red')
print(p2)
expand(p2, node=23) %>% expand(node=21)

利用三角形隐藏/展示某个clade

1
2
3
4
5
6
7
8
9
10
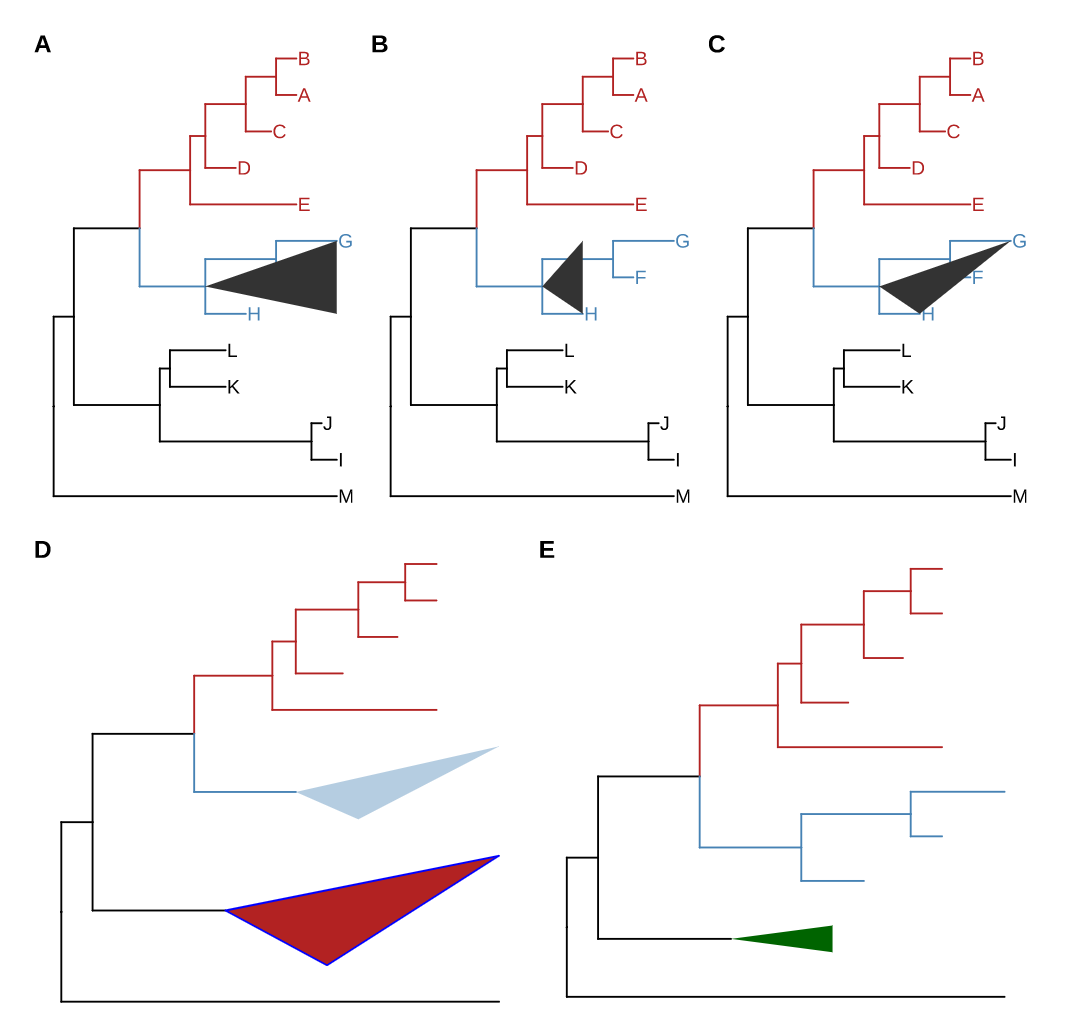
p2 <- p + geom_tiplab()
node <- 21
collapse(p2, node, 'max') %>% expand(node)
collapse(p2, node, 'min') %>% expand(node)
collapse(p2, node, 'mixed') %>% expand(node)

collapse(p, 21, 'mixed', fill='steelblue', alpha=.4) %>%
collapse(23, 'mixed', fill='firebrick', color='blue')

scaleClade(p, 23, .2) %>% collapse(23, 'min', fill="darkgreen")

分组Taxa

1
2
3
4
5
6
7
8
9
10
11
12
13
14
15
16
17
library(ggsci)

data(iris)
rn <- paste0(iris[,5], "_", 1:150)
rownames(iris) <- rn
d_iris <- dist(iris[,-5], method="man")

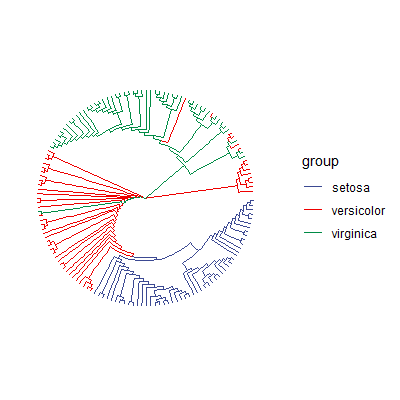
tree_iris <- ape::bionj(d_iris)
grp <- list(setosa = rn[1:50],
versicolor = rn[51:100],
virginica = rn[101:150])

p_iris <- ggtree(tree_iris, layout = 'circular', branch.length='none')
groupOTU(p_iris, grp, 'group') +
aes(color=group) +
scale_color_aaas() +
theme(legend.position="right")

另外一种方法:

1
2
3
tree_iris <- groupOTU(tree_iris, grp, "Species")
ggtree(tree_iris, aes(color=Species), layout = 'circular', branch.length = 'none') +
theme(legend.position="right")

旋转clade

旋转clade有两种方法:

1
2
3
p1 <- p + geom_point2(aes(subset=node==16), color='darkgreen', size=5)
p2 <- rotate(p1, 17) %>% rotate(21) # 方法1
flip(p2, 17, 21) # 方法2

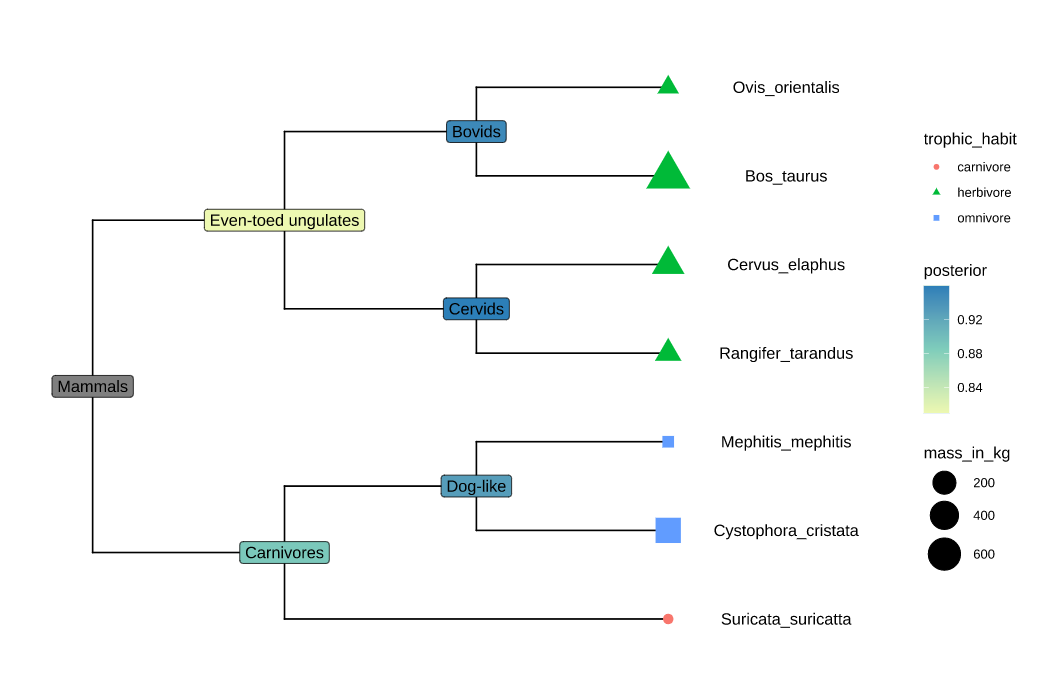
外部数据mapping到树上

1
2
3
4
5
6
7
8
9
10
11
12
13
14
15
16
17
18
19
20
library(ggimage)
library(ggtree)

# 文件下载地址
# https://raw.githubusercontent.com/YuLab-SMU/treedata-book/master/data/tree_boots.nwk
# https://raw.githubusercontent.com/YuLab-SMU/treedata-book/master/data/tip_data.csv


x <- read.tree("tree_boots.nwk")
info <- read.csv("tip_data.csv")

p <- ggtree(x) %<+% info + xlim(-.1, 4)
p2 <- p + geom_tiplab(offset = .6, hjust = .5) +
geom_tippoint(aes(shape = trophic_habit, color = trophic_habit, size = mass_in_kg)) +
theme(legend.position = "right") + scale_size_continuous(range = c(3, 10))

#https://raw.githubusercontent.com/YuLab-SMU/treedata-book/master/data/inode_data.csv
d2 <- read.csv("inode_data.csv")
p2 %<+% d2 + geom_label(aes(label = vernacularName.y, fill = posterior)) +
scale_fill_gradientn(colors = RColorBrewer::brewer.pal(3, "YlGnBu"))

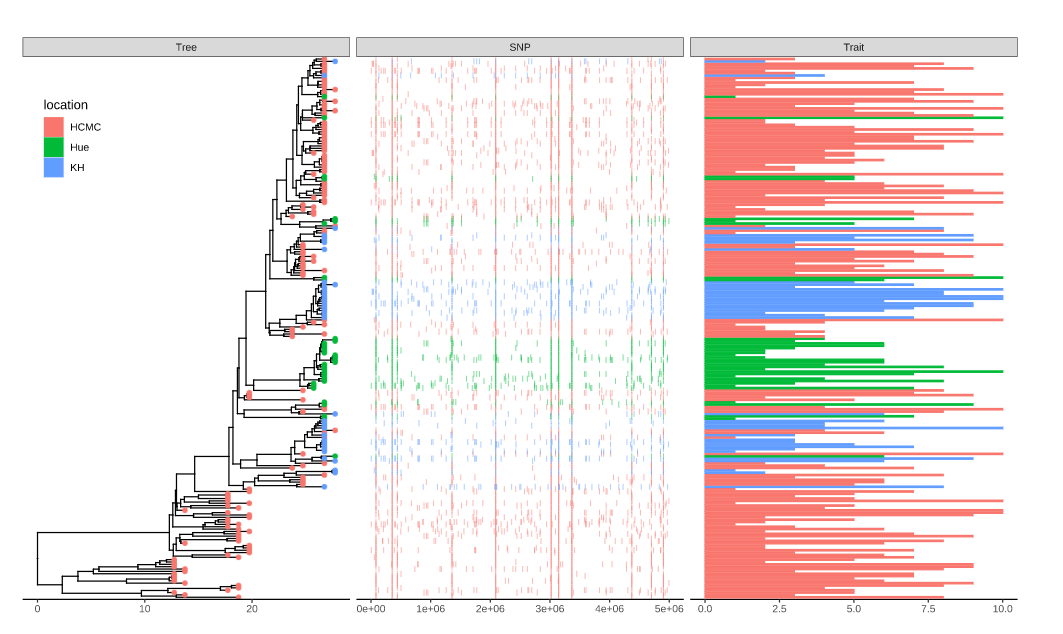
将SNP数据添加到树上

1
2
3
4
5
6
7
8
9
10
11
12
13
14
15
16
17
18
19
20
21
22
23
24
25
26
27
28
29
30
31
32
33
34
35
36
37
38
39
40
41
42
43
44
45
46
library(ggtree)
## remote_folder <- paste0("https://raw.githubusercontent.com/katholt/",
## "plotTree/master/tree_example_april2015/")
remote_folder <- "data/tree_example_april2015/"

## read the phylogenetic tree
tree <- read.tree(paste0(remote_folder, "tree.nwk"))

## read the sampling information data set
info <- read.csv(paste0(remote_folder,"info.csv"))

## read and process the allele table
snps<-read.csv(paste0(remote_folder, "alleles.csv"), header = F,
row.names = 1, stringsAsFactor = F)
snps_strainCols <- snps[1,]
snps<-snps[-1,] # drop strain names
colnames(snps) <- snps_strainCols

gapChar <- "?"
snp <- t(snps)
lsnp <- apply(snp, 1, function(x) {
x != snp[1,] & x != gapChar & snp[1,] != gapChar
})
lsnp <- as.data.frame(lsnp)
lsnp$pos <- as.numeric(rownames(lsnp))
lsnp <- tidyr::gather(lsnp, name, value, -pos)
snp_data <- lsnp[lsnp$value, c("name", "pos")]

## read the trait data
bar_data <- read.csv(paste0(remote_folder, "bar.csv"))

## visualize the tree
p <- ggtree(tree)

## attach the sampling information data set
## and add symbols colored by location
p <- p %<+% info + geom_tippoint(aes(color=location))

## visualize SNP and Trait data using dot and bar charts,
## and align them based on tree structure
p + geom_facet(panel = "SNP", data = snp_data, geom = geom_point,
mapping=aes(x = pos, color = location), shape = '|') +
geom_facet(panel = "Trait", data = bar_data, geom = ggstance::geom_barh,
aes(x = dummy_bar_value, color = location, fill = location),
stat = "identity", width = .6) +
theme_tree2(legend.position=c(.05, .85))

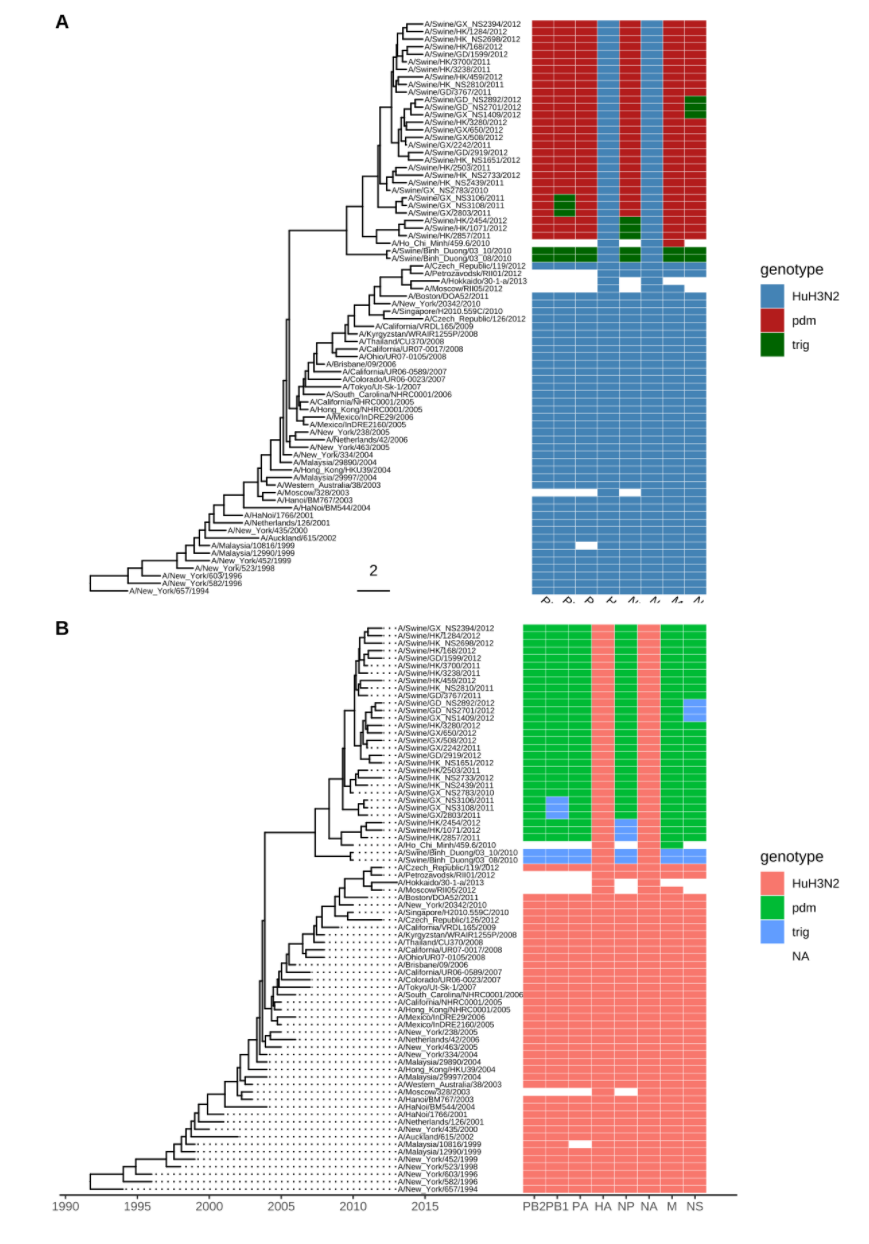
关联矩阵

1
2
3
4
5
6
7
8
9
10
11
12
13
14
15
16
17
18
19
20
21
beast_file <- system.file("examples/MCC_FluA_H3.tree", package="ggtree")
beast_tree <- read.beast(beast_file)

genotype_file <- system.file("examples/Genotype.txt", package="ggtree")
genotype <- read.table(genotype_file, sep="\t", stringsAsFactor=F)
colnames(genotype) <- sub("\\.$", "", colnames(genotype))
p <- ggtree(beast_tree, mrsd="2013-01-01") +
geom_treescale(x=2008, y=1, offset=2) +
geom_tiplab(size=2)
gheatmap(p, genotype, offset=5, width=0.5, font.size=3,
colnames_angle=-45, hjust=0) +
scale_fill_manual(breaks=c("HuH3N2", "pdm", "trig"),
values=c("steelblue", "firebrick", "darkgreen"), name="genotype")

p <- ggtree(beast_tree, mrsd="2013-01-01") +
geom_tiplab(size=2, align=TRUE, linesize=.5) +
theme_tree2()
gheatmap(p, genotype, offset=8, width=0.6,
colnames=FALSE, legend_title="genotype") +
scale_x_ggtree() +
scale_y_continuous(expand=c(0, 0.3))

关联多个矩阵

1
2
3
4
5
6
7
8
9
10
11
12
13
14
15
16
17
18
19
20
21
22
23
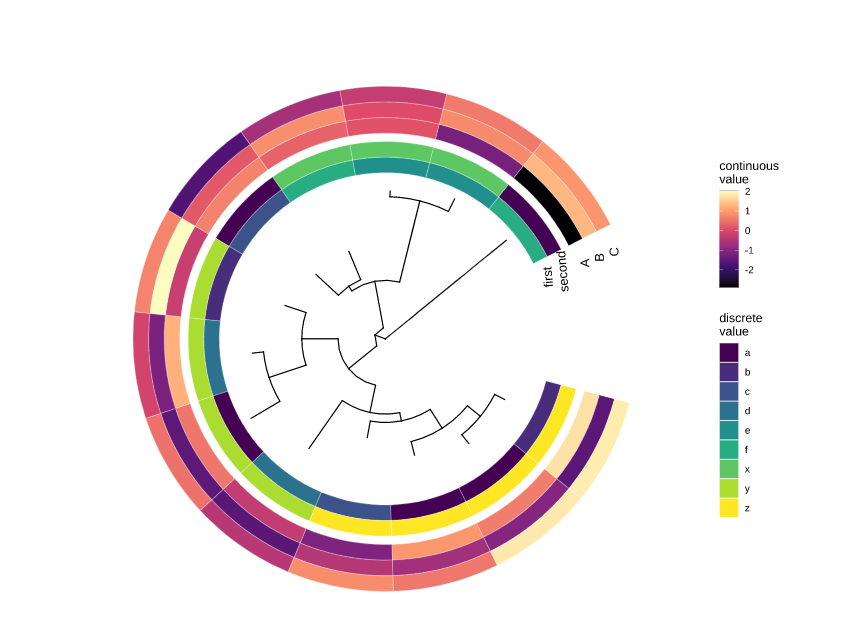
24
nwk <- system.file("extdata", "sample.nwk", package="treeio")

tree <- read.tree(nwk)
circ <- ggtree(tree, layout = "circular")

df <- data.frame(first=c("a", "b", "a", "c", "d", "d", "a", "b", "e", "e", "f", "c", "f"),
second= c("z", "z", "z", "z", "y", "y", "y", "y", "x", "x", "x", "a", "a"))
rownames(df) <- tree$tip.label

df2 <- as.data.frame(matrix(rnorm(39), ncol=3))
rownames(df2) <- tree$tip.label
colnames(df2) <- LETTERS[1:3]


p1 <- gheatmap(circ, df, offset=.8, width=.2,
colnames_angle=95, colnames_offset_y = .25) +
scale_fill_viridis_d(option="D", name="discrete\nvalue")


library(ggnewscale)
p2 <- p1 + new_scale_fill()
gheatmap(p2, df2, offset=15, width=.3,
colnames_angle=90, colnames_offset_y = .25) +
scale_fill_viridis_c(option="A", name="continuous\nvalue")

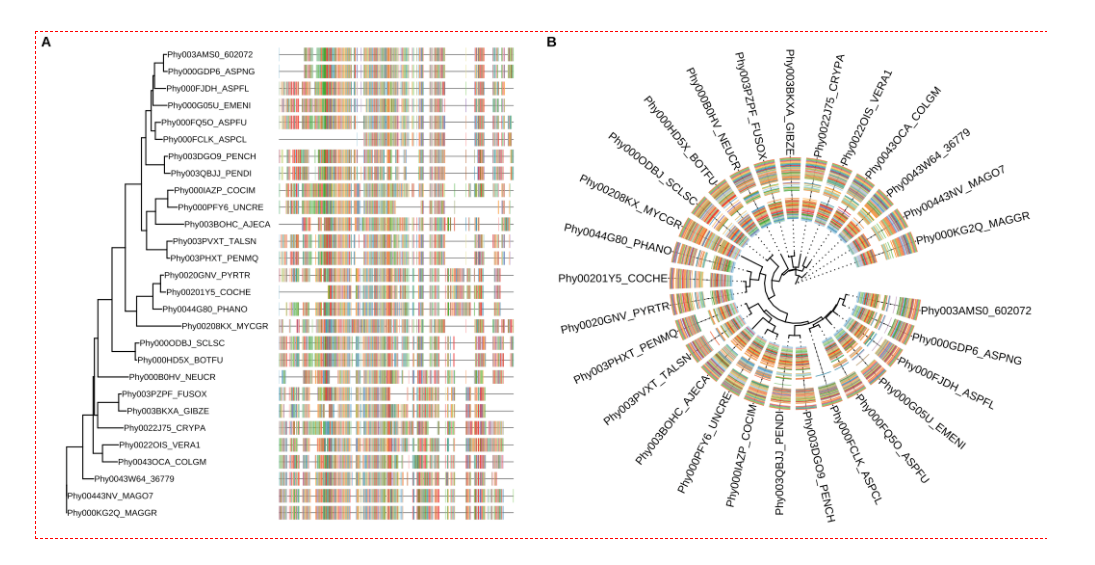
多序列比对可视化

1
2
3
4
5
6
tree <- read.tree("data/tree.nwk")
p <- ggtree(tree) + geom_tiplab(size=3)
msaplot(p, "data/sequence.fasta", offset=3, width=2)
p <- ggtree(tree, layout='circular') +
geom_tiplab(offset=4, align=TRUE) + xlim(NA, 12)
msaplot(p, "data/sequence.fasta", window=c(120, 200))

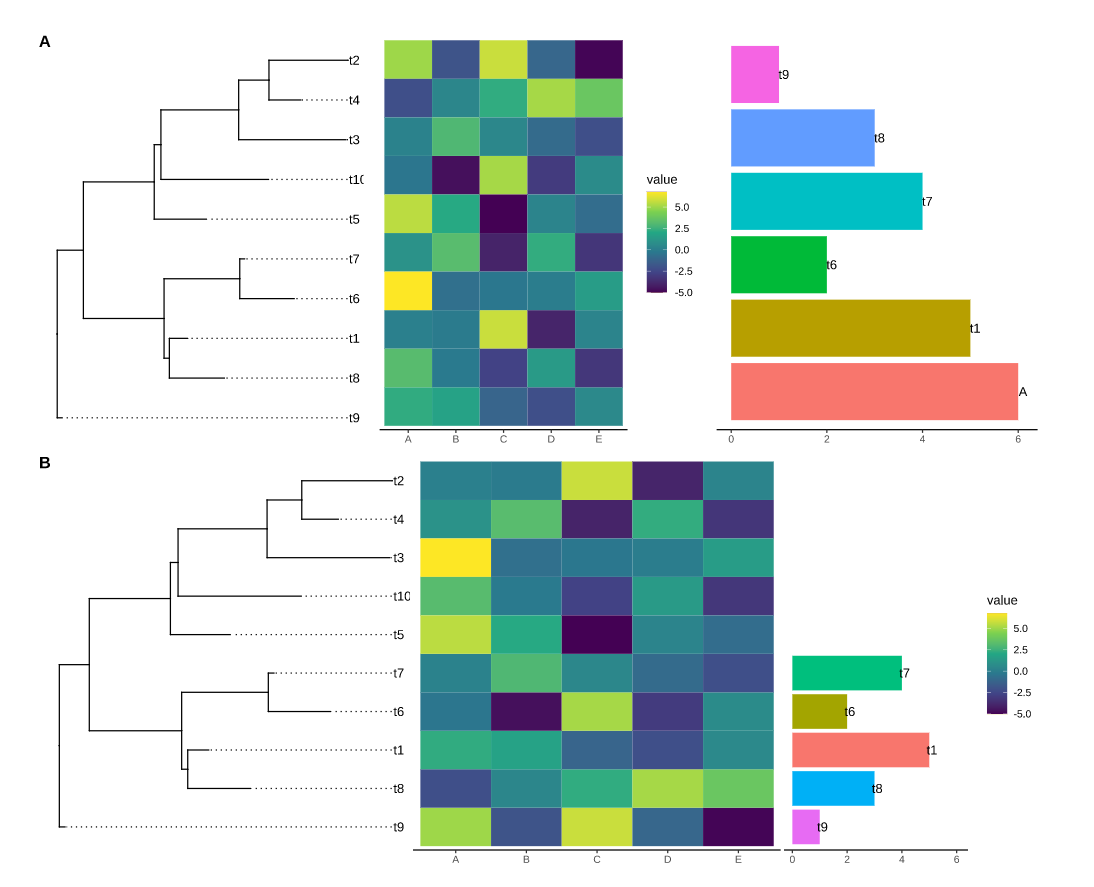
拼图

1
2
3
4
5
6
7
8
9
10
11
12
13
14
15
16
17
18
19
20
21
22
23
24
25
26
27
28
29
30
library(ggplot2)
library(ggtree)

set.seed(2019-10-31)
tr <- rtree(10)

d1 <- data.frame(
# only some labels match
label = c(tr$tip.label[sample(5, 5)], "A"),
value = sample(1:6, 6))

d2 <- data.frame(
label = rep(tr$tip.label, 5),
category = rep(LETTERS[1:5], each=10),
value = rnorm(50, 0, 3))

g <- ggtree(tr) + geom_tiplab(align=TRUE)

p1 <- ggplot(d1, aes(label, value)) + geom_col(aes(fill=label)) +
geom_text(aes(label=label, y= value+.1)) +
coord_flip() + theme_tree2() + theme(legend.position='none')

p2 <- ggplot(d2, aes(x=category, y=label)) +
geom_tile(aes(fill=value)) + scale_fill_viridis_c() +
theme_tree2()

cowplot::plot_grid(g, p2, p1, ncol=3)

library(aplot)
p2 %>% insert_left(g) %>% insert_right(p1, width=.5)

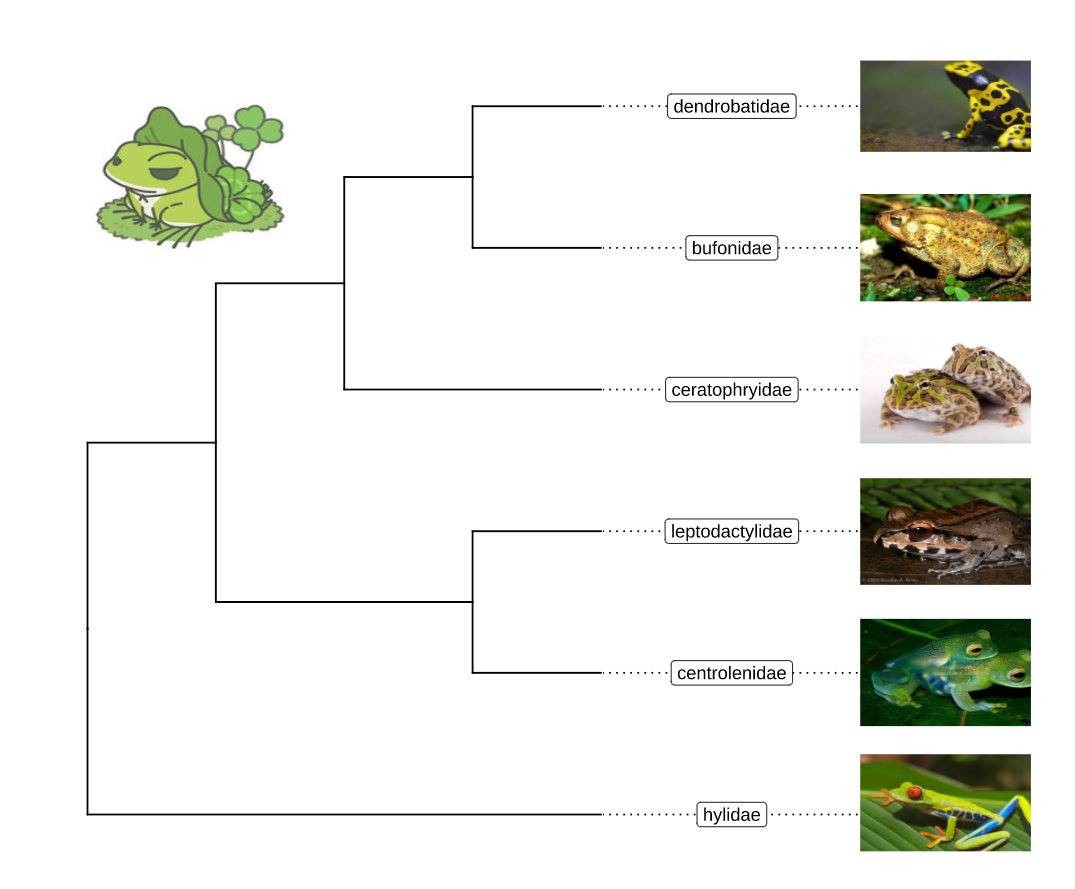
图片注释

没能找到图片下载地址,看代码很容易理解:

1
2
3
4
5
6
7
8
9
10
11
library(ggimage)
library(ggtree)

nwk <- "((((bufonidae, dendrobatidae), ceratophryidae), (centrolenidae, leptodactylidae)), hylidae);"

x = read.tree(text = nwk)
ggtree(x) + xlim(NA, 7) + ylim(NA, 6.2) +
geom_tiplab(aes(image=paste0("img/frogs/", label, '.jpg')),
geom="image", offset=2, align=2, size=.2) +
geom_tiplab(geom='label', offset=1, hjust=.5) +
geom_image(x=.8, y=5.5, image="img/frogs/frog.jpg", size=.2)

图标(剪影)注释

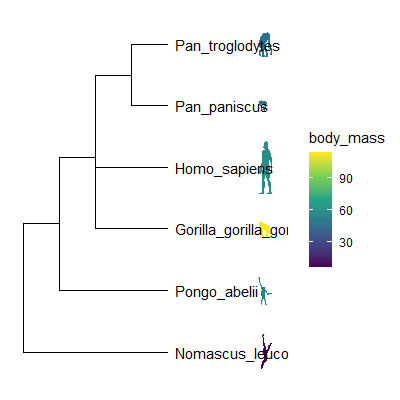
PhyloPic提供了1300余种生物剪影,ggtree能够调用这个数据库中的生物图标进行注释,相当于上面的图片。这种情况下绘图稍微有点慢,毕竟这个数据库是国外的。

1
2
3
4
5
6
7
8
9
10
11
12
library(ggtree)
newick <- "((Pongo_abelii,(Gorilla_gorilla_gorilla,(Pan_paniscus,Pan_troglodytes)Pan,Homo_sapiens)Homininae)Hominidae,Nomascus_leucogenys)Hominoidea;"

tree <- read.tree(text=newick)

d <- ggimage::phylopic_uid(tree$tip.label)
d$body_mass = c(52, 114, 47, 45, 58, 6)

p <- ggtree(tree) %<+% d +
geom_tiplab(aes(image=uid, colour=body_mass), geom="phylopic", offset=2.5) +
geom_tiplab(aes(label=label), offset = .2) + xlim(NA, 7) +
scale_color_viridis_c()

使用子图进行注释

用子图进行注释是通过函数geom_inset()来完成的。

条形图注释

1
2
3
4
5
6
7
8
9
10
11
12
13
14
15
16
17
18
19
20
21
library(phytools)
data(anoletree)
x <- getStates(anoletree,"tips")
tree <- anoletree

cols <- setNames(palette()[1:length(unique(x))],sort(unique(x)))
fitER <- ape::ace(x,tree,model="ER",type="discrete")
ancstats <- as.data.frame(fitER$lik.anc)
ancstats$node <- 1:tree$Nnode+Ntip(tree)

## cols parameter indicate which columns store stats
bars <- nodebar(ancstats, cols=1:6)
bars <- lapply(bars, function(g) g+scale_fill_manual(values = cols))

tree2 <- full_join(tree, data.frame(label = names(x), stat = x ), by = 'label')
p <- ggtree(tree2) + geom_tiplab() +
geom_tippoint(aes(color = stat)) +
scale_color_manual(values = cols) +
theme(legend.position = "right") +
xlim(NA, 8)
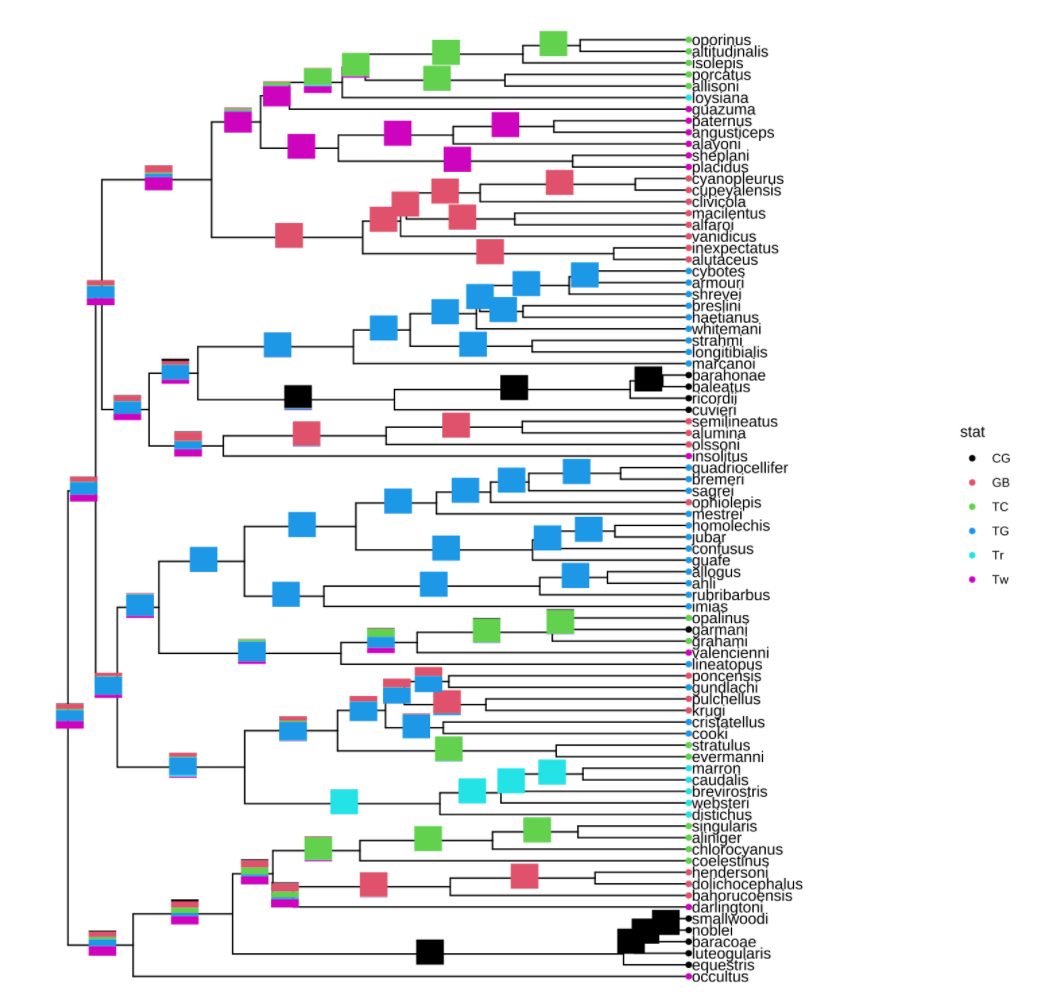
p + geom_inset(bars, width = .08, height = .05, x = "branch")

饼图注释

1
2
3
4
5
6
7
8
9
10
11
12
13
14
15
16
17
18
19
20
21
22
23
library(phytools)
library(treeio)
library(tidytree)
data(anoletree)
x <- getStates(anoletree,"tips")
tree <- anoletree

cols <- setNames(palette()[1:length(unique(x))],sort(unique(x)))
fitER <- ape::ace(x,tree,model="ER",type="discrete")
ancstats <- as.data.frame(fitER$lik.anc)
ancstats$node <- 1:tree$Nnode+Ntip(tree)

pies <- nodepie(ancstats, cols = 1:6)
pies <- lapply(pies, function(g) g+scale_fill_manual(values = cols))

tree2 <- full_join(tree, data.frame(label = names(x), stat = x ), by = 'label')
p <- ggtree(tree2) + geom_tiplab() +
geom_tippoint(aes(color = stat)) +
scale_color_manual(values = cols) +
theme(legend.position = "right") +
xlim(NA, 8)

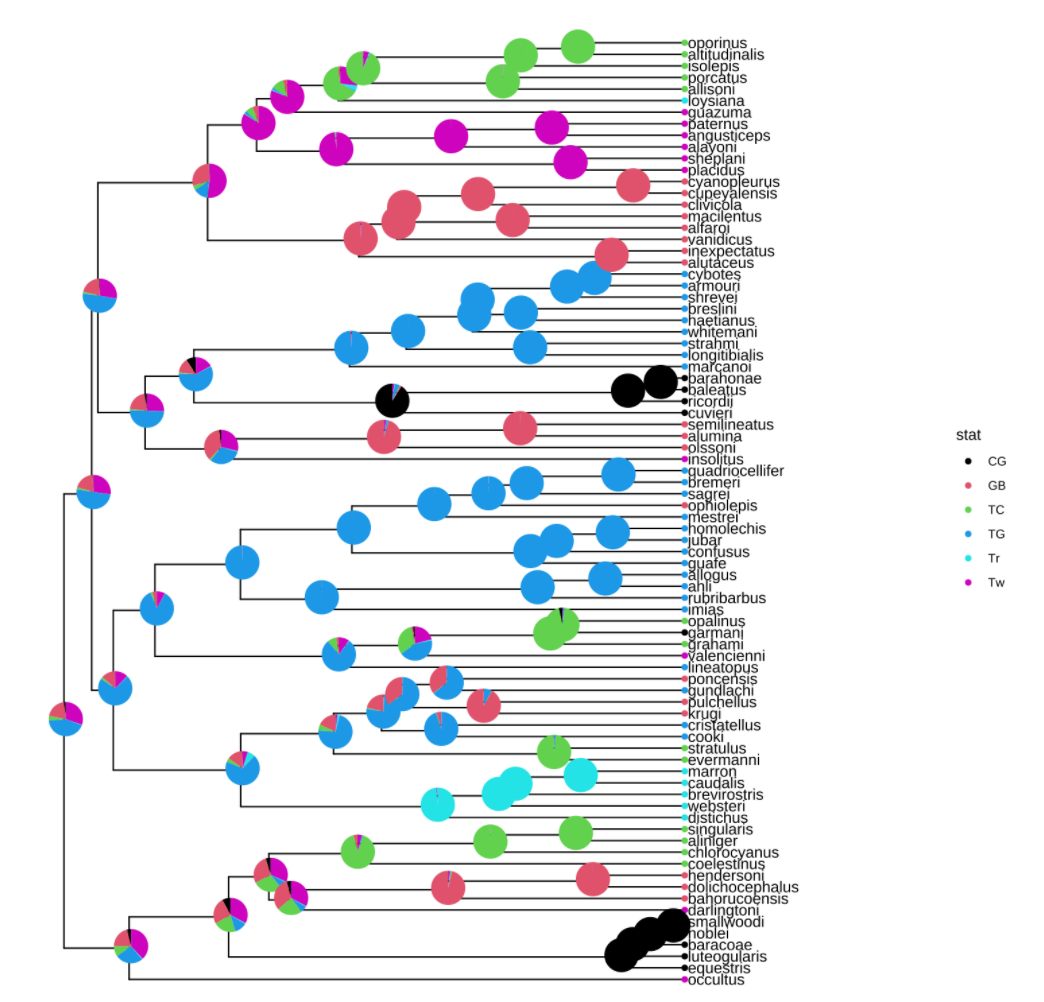
p + geom_inset(pies, width = .1, height = .1)

多种图像组合注释

1
2
3
4
pies_and_bars <- pies
i <- sample(length(pies), 20)
pies_and_bars[i] <- bars[i]
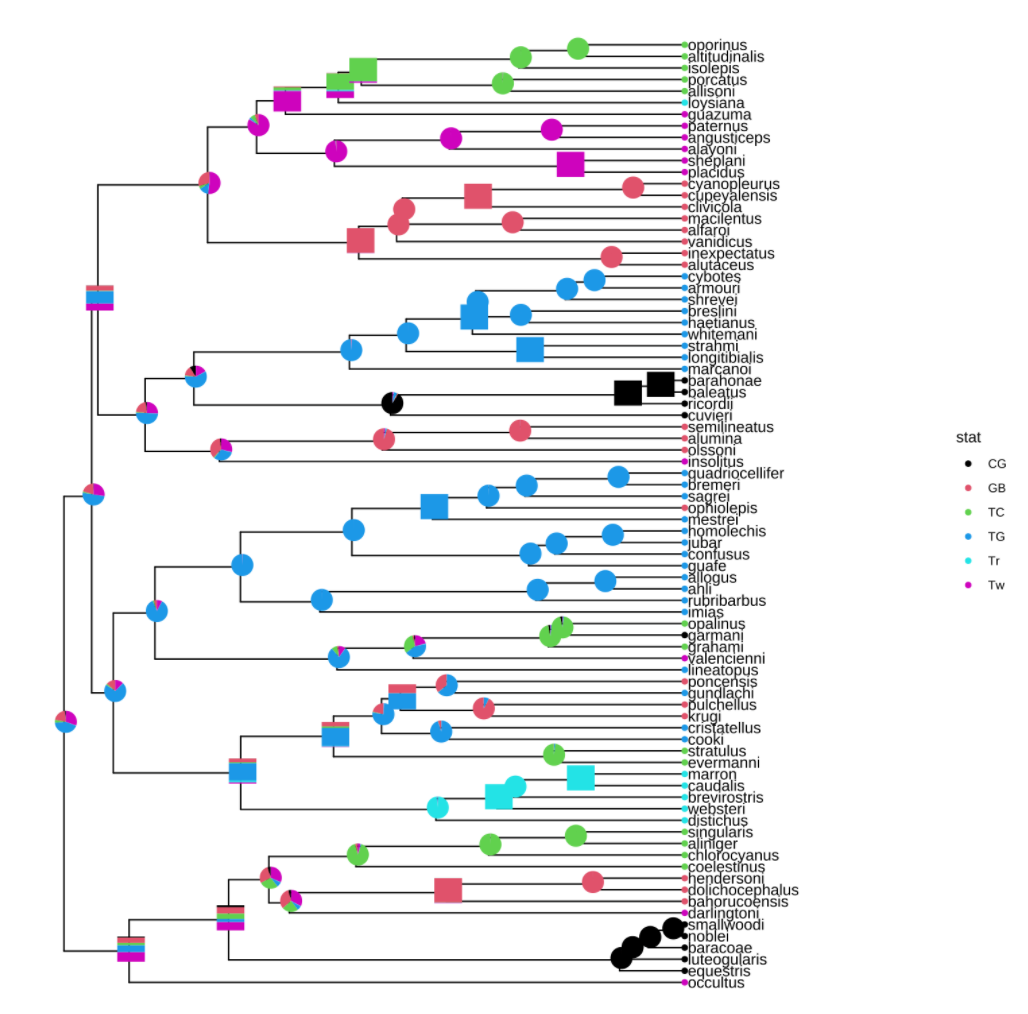
p + geom_inset(pies_and_bars, width=.08, height=.05)

Phylomoji注释

1
2
3
4
5
6
7
8
9
10
11
12
13
14
15
library(ggplot2)
library(ggtree)
# install.packages('emojifont')

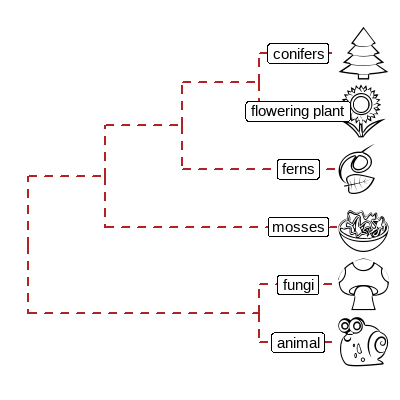
tt = '((snail,mushroom),(((sunflower,evergreen_tree),leaves),green_salad));'
tree = read.tree(text = tt)
d <- data.frame(label = c('snail','mushroom', 'sunflower',
'evergreen_tree','leaves', 'green_salad'),
group = c('animal', 'fungi', 'flowering plant',
'conifers', 'ferns', 'mosses'))

ggtree(tree, linetype = "dashed", size=1, color='firebrick') %<+% d +
xlim(0, 4.5) + ylim(0.5, 6.5) +
geom_tiplab(parse="emoji", size=15, vjust=.25) +
geom_tiplab(aes(label = group), geom="label", x=3.5, hjust=.5)

Emoji注释circular/fan树

1
2
3
4
5
6
7
8
9
p <- ggtree(tree, layout = "circular", size=1) +  
geom_tiplab(parse="emoji", size=10, vjust=.25)
print(p)

## fan layout
p2 <- open_tree(p, angle=200)
print(p2)

p2 %>% rotate_tree(-90)

Emoji注释clades

1
2
3
4
5
6
7
8
9
10
set.seed(123)
tr <- rtree(30)

ggtree(tr) + xlim(NA, 5.2) +
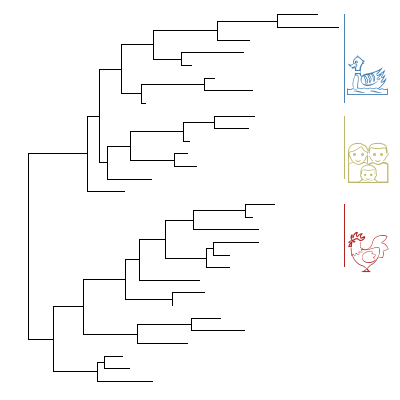
geom_cladelabel(node=41, label="chicken", parse="emoji",
fontsize=12, align=TRUE, colour="firebrick") +
geom_cladelabel(node=53, label="duck", parse="emoji",
fontsize=12, align=TRUE, colour="steelblue") +
geom_cladelabel(node=48, label="family", parse="emoji",
fontsize=12, align=TRUE, colour="darkkhaki")

AppleColorEmoji

1
2
3
4
5
6
7
8
9
10
11
12
library(ggtree)
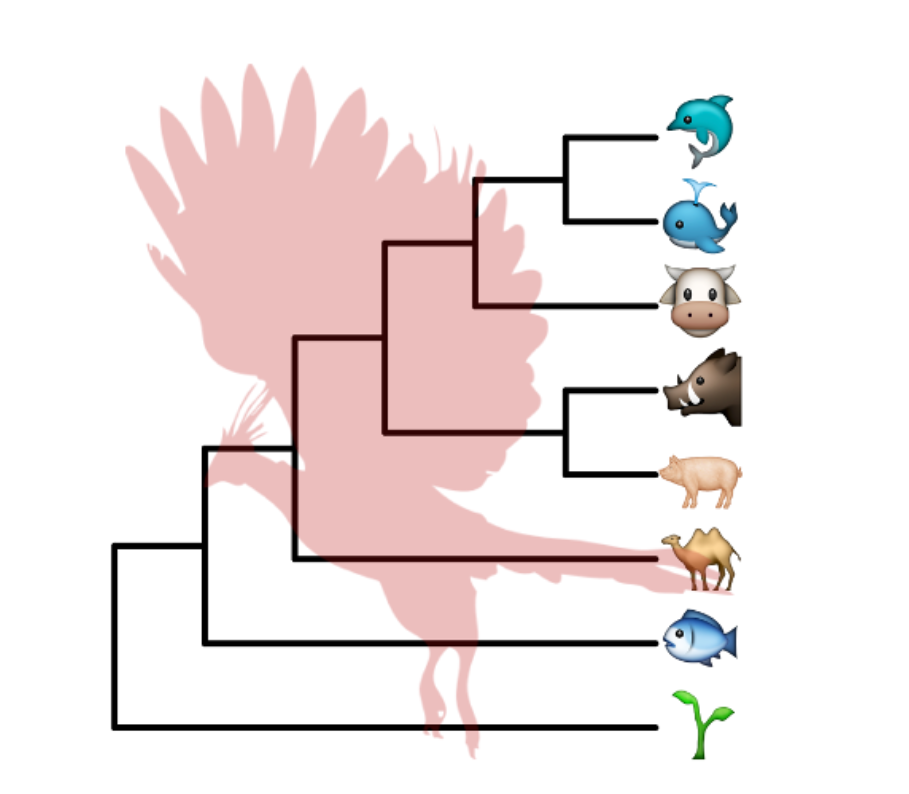
tree_text <- "(((((cow, (whale, dolphin)), (pig2, boar)), camel), fish), seedling);"
x <- read.tree(text=tree_text)
library(ggimage)
library(gridSVG)
p <- ggtree(x, size=2) + geom_tiplab(size=20, parse='emoji') +
xlim(NA, 7) + ylim(NA, 8.5) +
geom_phylopic(image="79ad5f09-cf21-4c89-8e7d-0c82a00ce728",
color="firebrick", alpha = .3, size=Inf)

p
ps = grid.export("emoji.svg", addClass=T)

ggtree可视化其他数据

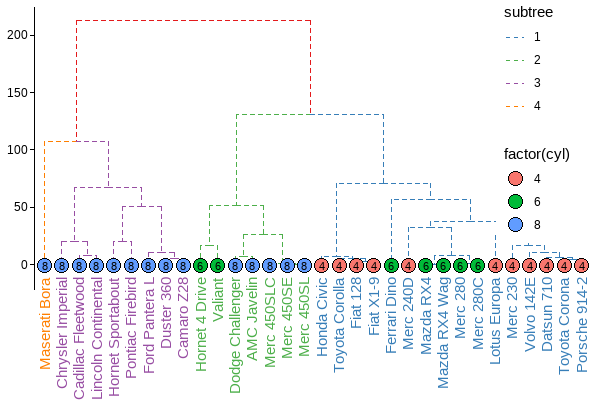
ggtree支持其他的数据类型,比如树状图(更多格式请移步Y叔博客):

1
2
3
4
5
6
7
8
9
10
11
12
13
14
15
16
17
18
19
20
21
hc <- hclust(dist(mtcars))
hc
clus <- cutree(hc, 4)
g <- split(names(clus), clus)

p <- ggtree(hc, linetype='dashed')
clades <- sapply(g, function(n) MRCA(p, n))

p <- groupClade(p, clades, group_name='subtree') + aes(color=subtree)

d <- data.frame(label = names(clus),
cyl = mtcars[names(clus), "cyl"])

p %<+% d +
layout_dendrogram() +
geom_tippoint(size=5, shape=21, aes(fill=factor(cyl), x=x+.5), color='black') +
geom_tiplab(aes(label=cyl), size=3, hjust=.5, color='black') +
geom_tiplab(angle=90, hjust=1, offset=-10, show.legend=F) +
scale_color_brewer(palette='Set1', breaks=1:4) +
theme_dendrogram(plot.margin=margin(6,6,80,6)) +
theme(legend.position=c(.9, .6))

ggtree拓展ggtreeExtra

ggtreeExtra真的是惊艳到我了,只能献出我的膝盖啊!

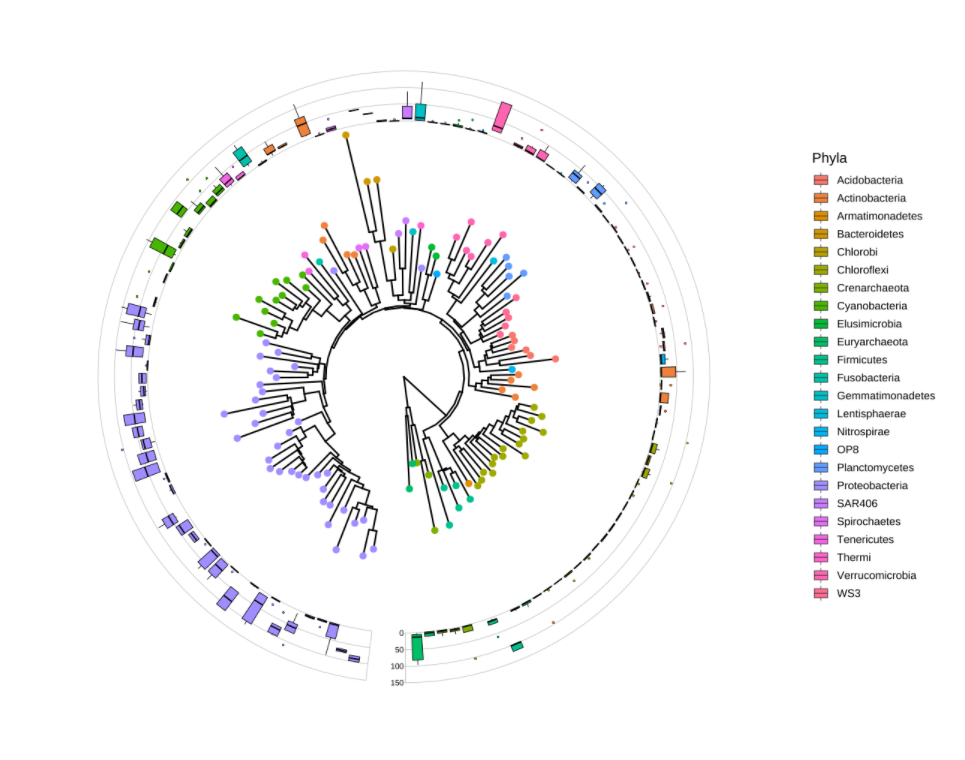
ggtree的函数geom_facet()只支持rectangularroundrectellipseslanted 这4种输出样式,并不支持在circularfanradial这几种输出样式的外环上添加图层,为了解决这个问题,Y叔团队开发了新的R包:ggtreeExtra

添加微生物组丰度

ggtree直接支持phyloseq对象,这个对做微生物的来说,简直就是福音啊!

1
2
3
4
5
6
7
8
9
10
11
12
13
14
15
16
17
18
19
20
21
22
23
24
25
26
27
28
29
30
31
32
33
34
35
36
37
38
39
40
41
42
43
44
45
46
47
48
49
50
51
52
53
54
55
56
57
58
library(ggtreeExtra)
library(ggtree)
library(phyloseq)
library(dplyr)

data("GlobalPatterns")
GP <- GlobalPatterns
GP <- prune_taxa(taxa_sums(GP) > 600, GP)
sample_data(GP)$human <- get_variable(GP, "SampleType") %in%
c("Feces", "Skin")
mergedGP <- merge_samples(GP, "SampleType")
mergedGP <- rarefy_even_depth(mergedGP,rngseed=394582)
mergedGP <- tax_glom(mergedGP,"Order")

melt_simple <- psmelt(mergedGP) %>%
filter(Abundance < 120) %>%
select(OTU, val=Abundance)

p <- ggtree(mergedGP, layout="fan", open.angle=10) +
geom_tippoint(mapping=aes(color=Phylum),
size=1.5,
show.legend=FALSE)
p <- rotate_tree(p, -90)

p <- p +
geom_fruit(
data=melt_simple,
geom=geom_boxplot,
mapping = aes(
y=OTU,
x=val,
group=label,
fill=Phylum,
),
size=.2,
outlier.size=0.5,
outlier.stroke=0.08,
outlier.shape=21,
axis.params=list(
axis = "x",
text.size = 1.8,
hjust = 1,
vjust = 0.5,
nbreak = 3,
),
grid.params=list()
)

p <- p +
scale_fill_discrete(
name="Phyla",
guide=guide_legend(keywidth=0.8, keyheight=0.8, ncol=1)
) +
theme(
legend.title=element_text(size=9), # The title of legend
legend.text=element_text(size=7) # The label text of legend, the sizes should be adjust with dpi.
)
p

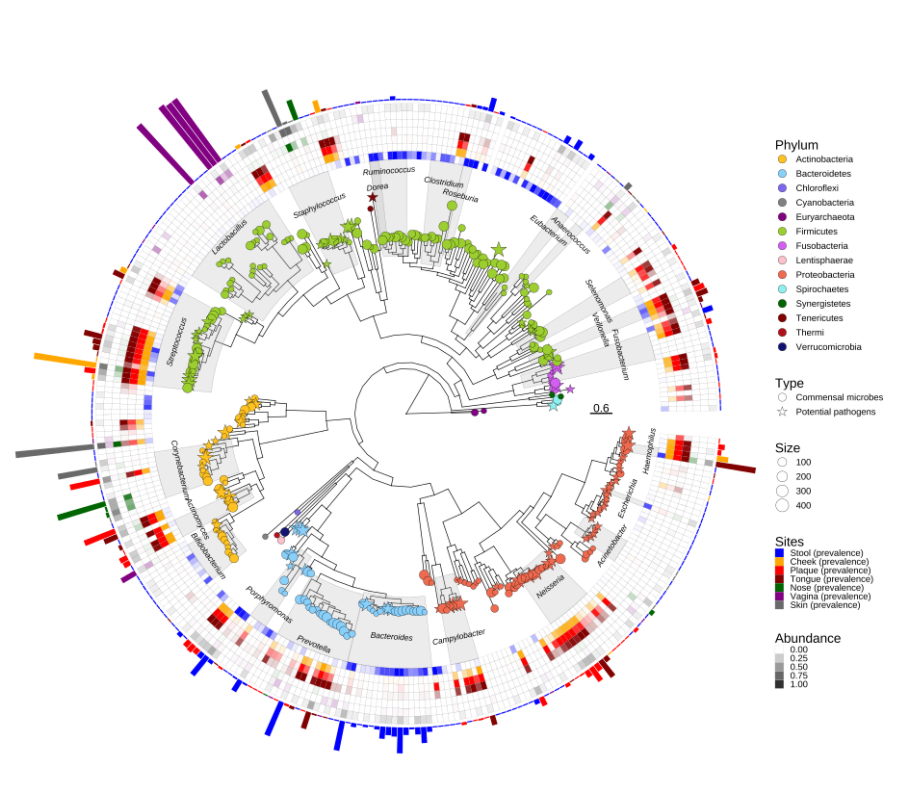
多维数据添加多个图层

⬇点击下载示例数据⬇

1
2
3
4
5
6
7
8
9
10
11
12
13
14
15
16
17
18
19
20
21
22
23
24
25
26
27
28
29
30
31
32
33
34
35
36
37
38
39
40
41
42
43
44
45
46
47
48
49
50
51
52
53
54
55
56
57
58
59
60
61
62
63
64
65
66
67
68
69
70
71
72
73
74
75
76
77
78
79
80
81
82
83
84
85
86
87
88
89
90
91
92
library(ggtreeExtra)
library(ggtree)
library(treeio)
library(tidytree)
library(ggstar)
library(ggplot2)
library(ggnewscale)

tree <- read.tree("data/HMP_tree/hmptree.nwk")
# the abundance and types of microbes
dat1 <- read.csv("data/HMP_tree/tippoint_attr.csv")
# the abundance of microbes at different body sites.
dat2 <- read.csv("data/HMP_tree/ringheatmap_attr.csv")
# the abundance of microbes at the body sites of greatest prevalence.
dat3 <- read.csv("data/HMP_tree/barplot_attr.csv")

# adjust the order
dat2$Sites <- factor(dat2$Sites, levels=c("Stool (prevalence)", "Cheek (prevalence)",
"Plaque (prevalence)","Tongue (prevalence)",
"Nose (prevalence)", "Vagina (prevalence)",
"Skin (prevalence)"))
dat3$Sites <- factor(dat3$Sites, levels=c("Stool (prevalence)", "Cheek (prevalence)",
"Plaque (prevalence)", "Tongue (prevalence)",
"Nose (prevalence)", "Vagina (prevalence)",
"Skin (prevalence)"))
# extract the clade label information. Because some nodes of tree are annotated to genera,
# which can be displayed with high light using ggtree.
nodeids <- nodeid(tree, tree$node.label[nchar(tree$node.label)>4])
nodedf <- data.frame(node=nodeids)
nodelab <- gsub("[\\.0-9]", "", tree$node.label[nchar(tree$node.label)>4])
# The layers of clade and hightlight
poslist <- c(1.6, 1.4, 1.6, 0.8, 0.1, 0.25, 1.6, 1.6, 1.2, 0.4,
1.2, 1.8, 0.3, 0.8, 0.4, 0.3, 0.4, 0.4, 0.4, 0.6,
0.3, 0.4, 0.3)
labdf <- data.frame(node=nodeids, label=nodelab, pos=poslist)

# The circular layout tree.
p <- ggtree(tree, layout="fan", size=0.15, open.angle=5) +
geom_hilight(data=nodedf, mapping=aes(node=node),
extendto=6.8, alpha=0.3, fill="grey", color="grey50",
size=0.05) +
geom_cladelab(data=labdf,
mapping=aes(node=node,
label=label,
offset.text=pos),
hjust=0.5,
angle="auto",
barsize=NA,
horizontal=FALSE,
fontsize=1.4,
fontface="italic"
)

p <- p %<+% dat1 + geom_star(
mapping=aes(fill=Phylum, starshape=Type, size=Size),
position="identity",starstroke=0.1) +
scale_fill_manual(values=c("#FFC125","#87CEFA","#7B68EE","#808080","#800080",
"#9ACD32","#D15FEE","#FFC0CB","#EE6A50","#8DEEEE",
"#006400","#800000","#B0171F","#191970"),
guide=guide_legend(keywidth = 0.5, keyheight = 0.5, order=1,
override.aes=list(starshape=15)),
na.translate=FALSE)+
scale_starshape_manual(values=c(15, 1),
guide=guide_legend(keywidth = 0.5, keyheight = 0.5, order=2),
na.translate=FALSE)+
scale_size_continuous(range = c(1, 2.5),
guide = guide_legend(keywidth = 0.5, keyheight = 0.5, order=3,
override.aes=list(starshape=15)))

p <- p + new_scale_fill() +
geom_fruit(data=dat2, geom=geom_tile,
mapping=aes(y=ID, x=Sites, alpha=Abundance, fill=Sites),
color = "grey50", offset = 0.04,size = 0.02)+
scale_alpha_continuous(range=c(0, 1),
guide=guide_legend(keywidth = 0.3, keyheight = 0.3, order=5)) +
geom_fruit(data=dat3, geom=geom_bar,
mapping=aes(y=ID, x=HigherAbundance, fill=Sites),
pwidth=0.38,
orientation="y",
stat="identity",
) +
scale_fill_manual(values=c("#0000FF","#FFA500","#FF0000","#800000",
"#006400","#800080","#696969"),
guide=guide_legend(keywidth = 0.3, keyheight = 0.3, order=4))+
geom_treescale(fontsize=2, linesize=0.3, x=4.9, y=0.1) +
theme(legend.position=c(0.93, 0.5),
legend.background=element_rect(fill=NA),
legend.title=element_text(size=6.5),
legend.text=element_text(size=4.5),
legend.spacing.y = unit(0.02, "cm"),
)
p

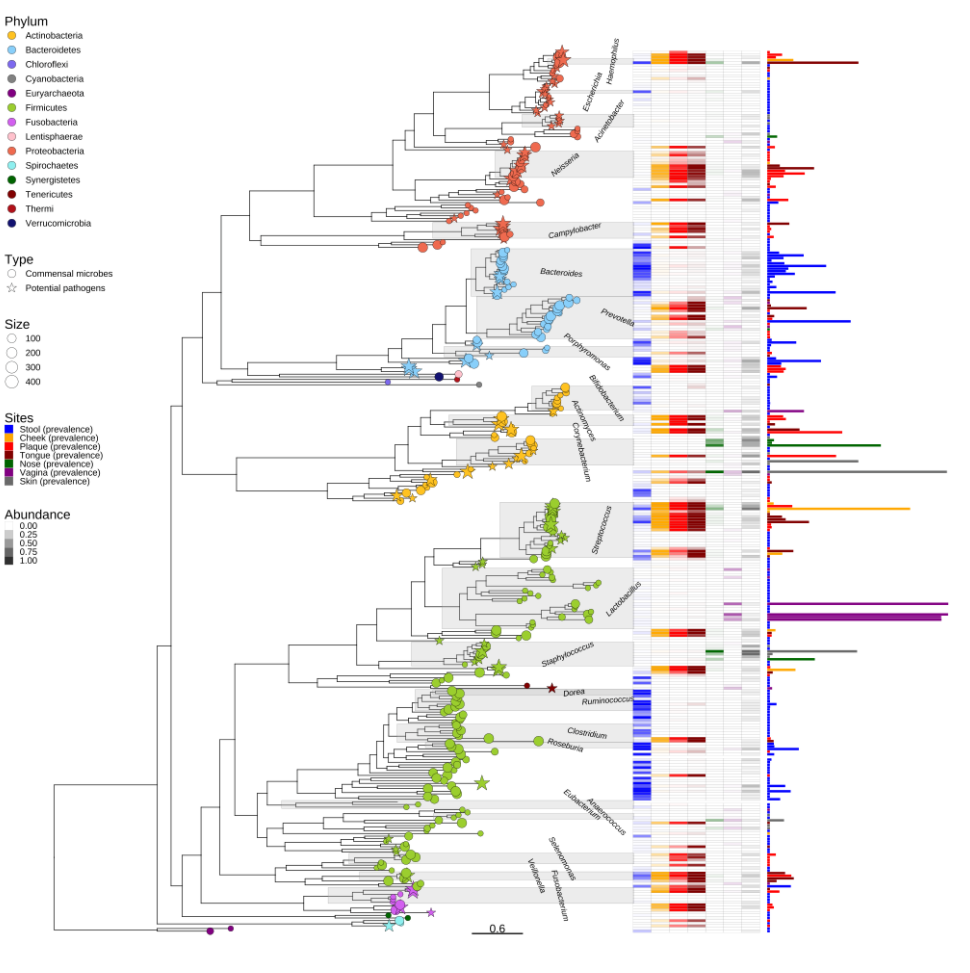
另外一种输出方式:

1
2
p + layout_rectangular() + 
theme(legend.position=c(.05, .7))

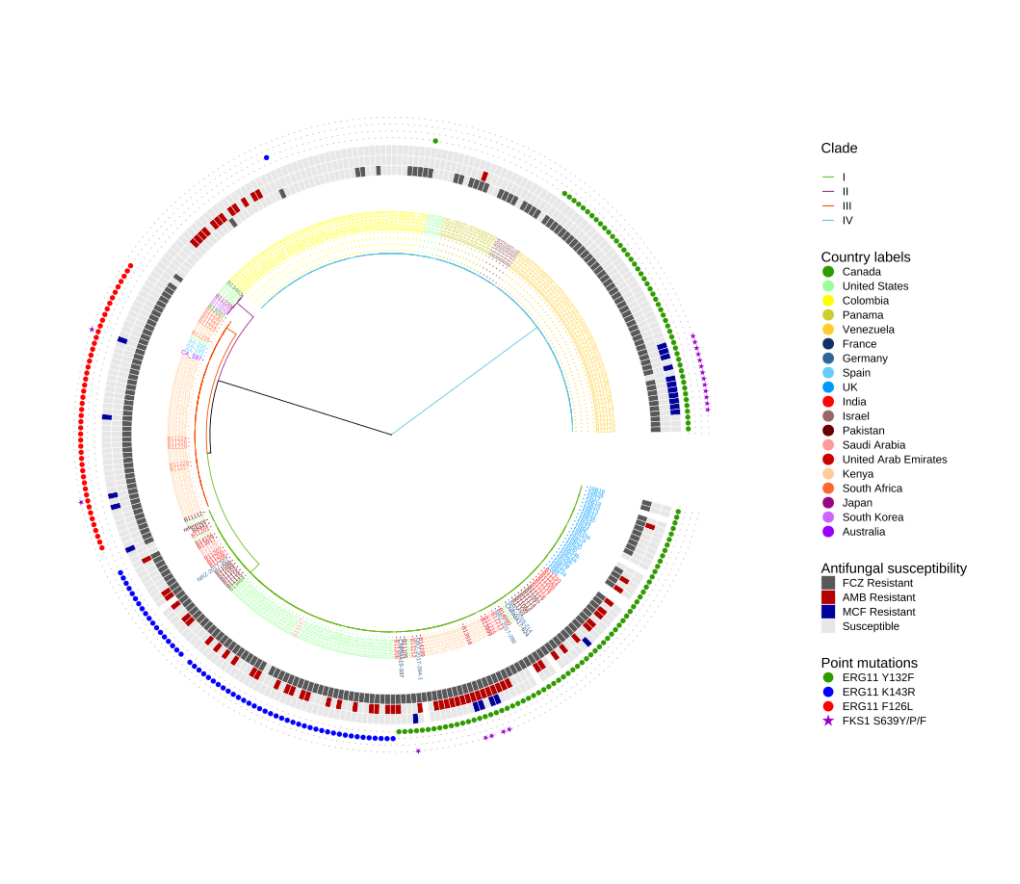
群体遗学传例子

1
2
3
4
5
6
7
8
9
10
11
12
13
14
15
16
17
18
19
20
21
22
23
24
25
26
27
28
29
30
31
32
33
34
35
36
37
38
39
40
41
42
43
44
45
46
47
48
49
50
51
52
53
54
55
56
57
58
59
60
61
62
63
64
65
66
67
68
69
70
71
72
73
74
75
76
77
78
79
80
81
82
83
84
85
86
87
88
89
90
91
92
93
94
95
96
97
98
99
100
101
102
103
104
105
106
107
108
109
110
111
112
113
114
115
116
117
118
119
120
121
122
123
124
125
126
127
128
129
130
131
132
133
134
135
136
137
138
139
140
141
142
143
144
145
146
147
148
149
150
151
library(ggtree)
library(ggtreeExtra)
library(ggplot2)
library(ggnewscale)
library(dplyr)
library(tidytree)
library(ggstar)

dat <- read.csv("data/microreact/Candida_auris/microreact-project-Candidaauris-data.csv")
tr <- read.tree("data/microreact/Candida_auris/microreact-project-Candidaauris-tree.nwk")

countries <- c("Canada", "United States",
"Colombia", "Panama",
"Venezuela", "France",
"Germany", "Spain",
"UK", "India",
"Israel", "Pakistan",
"Saudi Arabia", "United Arab Emirates",
"Kenya", "South Africa",
"Japan", "South Korea",
"Australia")
# For the tip points
dat1 <- dat %>% select(c("ID", "COUNTRY", "COUNTRY__colour"))
dat1$COUNTRY <- factor(dat1$COUNTRY, levels=countries)
COUNTRYcolors <- dat1[match(countries,dat$COUNTRY),"COUNTRY__colour"]

# For the heatmap layer
dat2 <- dat %>% select(c("ID", "FCZ", "AMB", "MCF"))
dat2 <- reshape2::melt(dat2,id="ID", variable.name="Antifungal", value.name="type")
dat2$type <- paste(dat2$Antifungal, dat2$type)
dat2$type <- unlist(lapply(dat2$type,
function(x)ifelse(grepl("Not_", x), "Susceptible", x)))
dat2$Antifungal <- factor(dat2$Antifungal, levels=c("FCZ", "AMB", "MCF"))
dat2$type <- factor(dat2$type,
levels=c("FCZ Resistant",
"AMB Resistant",
"MCF Resistant",
"Susceptible"))

# For the points layer
dat3 <- dat %>% select(c("ID", "ERG11", "FKS1")) %>%
reshape2::melt(id="ID", variable.name="point", value.name="mutation")
dat3$mutation <- paste(dat3$point, dat3$mutation)
dat3$mutation <- unlist(lapply(dat3$mutation, function(x)ifelse(grepl("WT",x), NA,x)))
dat3$mutation <- factor(dat3$mutation, levels=c("ERG11 Y132F", "ERG11 K143R",
"ERG11 F126L", "FKS1 S639Y/P/F"))

# For the clade group
dat4 <- dat %>% select(c("ID", "CLADE"))
dat4 <- aggregate(.~CLADE, dat4, FUN=paste, collapse=",")
clades <- lapply(dat4$ID, function(x){unlist(strsplit(x,split=","))})
names(clades) <- dat4$CLADE

tr <- groupOTU(tr, clades, "Clade")
Clade <- NULL
p <- ggtree(tr=tr, layout="fan", open.angle=15, size=0.2, aes(colour=Clade)) +
scale_colour_manual(
values=c("black","#69B920","#9C2E88","#F74B00","#60C3DB"),
labels=c("","I", "II", "III", "IV"),
guide=guide_legend(keywidth=0.5,
keyheight=0.5,
order=1,
override.aes=list(linetype=c("0"=NA,
"Clade1"=1,
"Clade2"=1,
"Clade3"=1,
"Clade4"=1
)
)
)
) +
new_scale_colour()

p1 <- p %<+% dat1 +
geom_tippoint(aes(colour=COUNTRY),
alpha=0) +
geom_tiplab(aes(colour=COUNTRY),
align=TRUE,
linetype=3,
size=1,
linesize=0.2,
show.legend=FALSE
) +
scale_colour_manual(
name="Country labels",
values=COUNTRYcolors,
guide=guide_legend(keywidth=0.5,
keyheight=0.5,
order=2,
override.aes=list(size=2,alpha=1))
)

p2 <- p1 +
geom_fruit(
data=dat2,
geom=geom_tile,
mapping=aes(x=Antifungal, y=ID, fill=type),
width=0.1,
color="white",
pwidth=0.1,
offset=0.15
) +
scale_fill_manual(
name="Antifungal susceptibility",
values=c("#595959", "#B30000", "#020099", "#E6E6E6"),
na.translate=FALSE,
guide=guide_legend(keywidth=0.5,
keyheight=0.5,
order=3
)
) +
new_scale_fill()

p3 <- p2 +
geom_fruit(
data=dat3,
geom=geom_star,
mapping=aes(x=mutation, y=ID, fill=mutation, starshape=point),
size=1,
starstroke=0,
pwidth=0.1,
inherit.aes = FALSE,
grid.params=list(
linetype=3,
size=0.2
)

) +
scale_fill_manual(
name="Point mutations",
values=c("#329901", "#0600FF", "#FF0100", "#9900CC"),
guide=guide_legend(keywidth=0.5, keyheight=0.5, order=4,
override.aes=list(starshape=c("ERG11 Y132F"=15,
"ERG11 K143R"=15,
"ERG11 F126L"=15,
"FKS1 S639Y/P/F"=1),
size=2)
),
na.translate=FALSE,
) +
scale_starshape_manual(
values=c(15, 1),
guide="none"
) +
theme(
legend.background=element_rect(fill=NA),
legend.title=element_text(size=7), # The size should be adjusted with different devout.
legend.text=element_text(size=5.5),
legend.spacing.y = unit(0.02, "cm")
)
p3

1
2
3
4
5
6
7
8
9
10
11
12
13
14
15
16
17
18
19
20
21
22
23
24
25
26
27
28
29
30
31
32
33
34
35
36
37
38
39
40
41
42
43
44
45
46
47
48
49
50
51
52
53
54
55
56
57
58
59
60
61
62
63
64
65
66
67
68
69
70
71
72
73
74
75
76
77
78
79
80
81
82
83
84
85
86
87
88
89
90
91
92
93
94
95
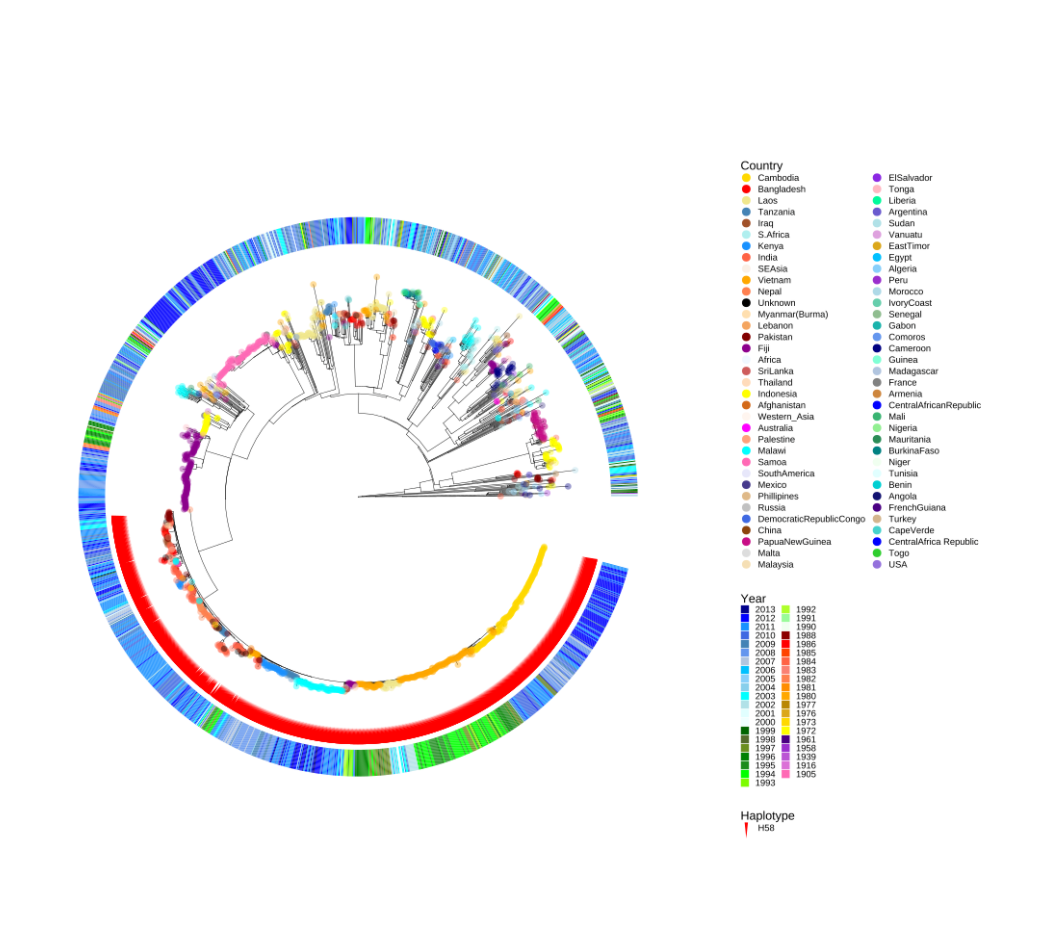
library(ggtreeExtra)
library(ggtree)
library(ggplot2)
library(ggnewscale)
library(treeio)
library(tidytree)
library(dplyr)
library(ggstar)

tr <- read.tree("data/microreact/Salmonella_Typhi/microreact-project-NJIDqgsS-tree.nwk")

metada <- read.csv("data/microreact/Salmonella_Typhi/microreact-project-NJIDqgsS-data.csv")

metadata <- metada %>%
select(c("id", "country", "country__colour", "year", "year__colour", "haplotype"))
metadata$haplotype <- unlist(lapply(metadata$haplotype, function(x)ifelse(nchar(x)>0,x,NA)))

countrycolors <- metada %>%
select(c("country", "country__colour")) %>%
distinct()

yearcolors <- metada %>%
select(c("year", "year__colour")) %>%
distinct()
yearcolors <- yearcolors[order(yearcolors$year, decreasing=TRUE),]

metadata$country <- factor(metadata$country, levels=countrycolors$country)
metadata$year <- factor(metadata$year, levels=yearcolors$year)

p <- ggtree(tr, layout="fan", open.angle=15, size=0.1)

p <- p %<+% metadata

p1 <-p +
geom_tippoint(
mapping=aes(colour=country),
size=1.5,
stroke=0,
alpha=0.4
) +
scale_colour_manual(
name="Country",
values=countrycolors$country__colour,
guide=guide_legend(keywidth=0.3,
keyheight=0.3,
ncol=2,
override.aes=list(size=2,alpha=1),
order=1)
) +
theme(
legend.title=element_text(size=5),
legend.text=element_text(size=4),
legend.spacing.y = unit(0.02, "cm")
)

p2 <-p1 +
geom_fruit(
geom=geom_star,
mapping=aes(fill=haplotype),
starshape=26,
color=NA,
size=2,
starstroke=0,
offset=0,
) +
scale_fill_manual(
name="Haplotype",
values=c("red"),
guide=guide_legend(
keywidth=0.3,
keyheight=0.3,
order=3
),
na.translate=FALSE
)

p3 <-p2 +
new_scale_fill() +
geom_fruit(
geom=geom_tile,
mapping=aes(fill=year),
width=0.002,
offset=0.1
) +
scale_fill_manual(
name="Year",
values=yearcolors$year__colour,
guide=guide_legend(keywidth=0.3, keyheight=0.3, ncol=2, order=2)
) +
theme(
legend.title=element_text(size=6), # The size should be adjusted with the different devout.
legend.text=element_text(size=4.5),
legend.spacing.y = unit(0.02, "cm")
)
p3

参考文献

[1]. Yu G, Smith D K, Zhu H, et al. ggtree: an R package for visualization and annotation of phylogenetic trees with their covariates and other associated data[J]. Methods in Ecology and Evolution, 2017, 8(1): 28-36.

[2]. https://yulab-smu.top/treedata-book/index.html

[3]. https://cosx.org/2015/11/to-achieve-the-visualization-and-annotation-of-evolutionary-tree-using-ggtree/

[4]. https://yulab-smu.top/treedata-book/chapter1.html

[5]. Wang L G, Lam T T Y, Xu S, et al. Treeio: an R package for phylogenetic tree input and output with richly annotated and associated data[J]. Molecular biology and evolution, 2020, 37(2): 599-603.

[6]. https://github.com/YuLab-SMU/tidytree

交流请联系:

💌lixiang117423@gmail.com

💌lixiang117423@foxmail.com


ggtree学习笔记
https://lixiang117423.github.io/article/fb57811f/
作者
小蓝哥
发布于
2021年2月15日
许可协议